View Calendar Details Example: Planned Make Order
This example describes a planned make order in an unconstrained plan.
You can tell it’s a make order because the Supplier and Source Organization fields aren’t displayed in the header section. This is an unconstrained plan. If this were a constrained plan, there would be two additional fields displayed in the header section: Earliest Start Date and Latest Start Date.
When looking at the Gantt chart of a make order, the Transit Lead Time and Suggested Ship Date rows aren’t displayed. Make orders aren’t shipped or received, so these dates don’t factor into the scheduling of a make order (planned or otherwise).
The Organization Manufacturing Calendar is used in calculating all suggested dates and lead times of a make order.
The red vertical line in the Gantt chart represents the plan start date, which is also shown in the header field. This line is only visible when the plan start date is within the visible portion of the Gantt window.
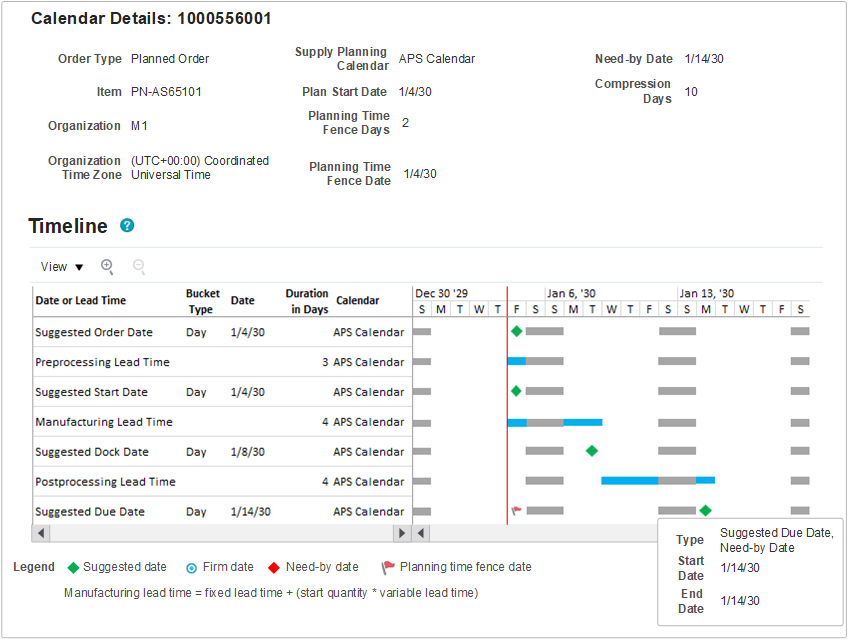
Planning uses backward scheduling to calculate supply dates, so we’ll analyze the dates starting from the Suggested Due Date (the last row).
| Date or Lead Time Row | Value | Explanation |
| Suggested Due Date | January 14 |
In this example, the Suggested Due Date is the same as the Need-by Date. Because unconstrained planning schedules supplies based on Need-by Date, it’s common that both dates are the same. When milestone dates overlap, the suggested date is always displayed on top in the Gantt chart. If you hover over the Suggested Due Date milestone, you can see that both Need-by Date and Suggested Due Date are on January 14. The Need-by Date is also displayed in the header section for quick reference without having to hover. If needed, planning will move the Suggested Due Date out so that it’s on or after the Planning Time Fence Date. In this case, the Planning Time Fence Date is January 4 (the same day as the Plan Start Date), so there's no need to move the Suggested Due Date out. In this example, the Planning Time Fence Date is the same day as the Plan Start Date, even though the value of the Planning Time Fence Days is 2. This is because the planning time fence control plan option is not checked, so the Planning Time Fence Date defaults to the Plan Start Date. The calendar used in calculating the Suggested Due Date, as well as all other suggested dates, is the Organization Manufacturing Calendar. In this example, the calendar used is APS Calendar, which has Saturdays and Sundays as nonworking days, represented by gray bars in the Gantt chart. Planning always ensures that the Suggested Due Date is on a working day, however a planner may firm the order on a nonworking day. If the order is firmed, the Gantt chart will display the Suggested Due Date using the firm date icon (a blue circle), in place of the regular green diamond icon. The planning bucket type for this date and all other dates is day. This lets you know that the Suggested Due Date didn’t get moved to the last working day of the planning bucket, which is what happens when planning in aggregate planning buckets. |
| Postprocessing Lead Time | 4 days |
The Postprocessing Lead Time’s duration in days value comes from the Items page and includes any simulation set overrides. The end date of the Postprocessing Lead Time is set to the Suggested Due Date. The start date of the Postprocessing Lead Time is calculated by subtracting the Postprocessing Lead Time from the end date of the Postprocessing Lead Time, counting only the working days. In this example, the Postprocessing Lead Time starts at the beginning of the day on Wednesday, January 9, and goes through the end of the day on Monday, January 14 (skipping Saturday and Sunday, which are nonworking days). |
| Suggested Dock Date | January 8 | The Suggested Dock Date of January 8 matches what we expect to see, given the Postprocessing Lead Time. |
| Manufacturing Lead Time | 4 days |
The Manufacturing Lead Time’s duration in days value is calculated using the item’s fixed and variable lead time and includes any simulation set overrides, where Manufacturing Lead Time = Fixed Lead Time + (Start Quantity * Variable Lead Time). The Manufacturing Lead Time end date is set to the Suggested Dock Date. The start date of the Manufacturing Lead Time is calculated by subtracting the Manufacturing Lead Time from the end date of the Manufacturing Lead Time, counting only the working days. In this example, the Manufacturing Lead Time was compressed because the plan start date was reached. The Manufacturing Lead Time starts at the beginning of the day on January 4, which is the plan start date, and goes through the end of day on January 8, which accounts for only 3 of the 4 required manufacturing days. |
| Suggested Start Date | January 4 |
Because the plan start date has been reached, the Suggested Start Date is set to the plan start date. Planning will not schedule a suggested date that is earlier than plan start date. During backward scheduling, when the plan start date is reached, the Suggested Start Date will be set to the plan start date, even if the plan start date is a nonworking day. |
| Preprocessing Lead Time | 3 days |
The Preprocessing Lead Time’s duration in days value comes from the Items page and includes any simulation set overrides. Because the plan start date has already been reached, the Preprocessing Lead Time is compressed to the first day of the plan. |
| Suggested Order Date | January 4 |
In this example, planning has already reached the plan start date so the Suggested Order Date is placed on the first day of the plan (regardless of whether the first working day of the plan is a working day or not). The scheduling of a work order works differently from a planned make order. Refer to the work order example in this chapter to understand how planning calculates suggested dates on work orders. |