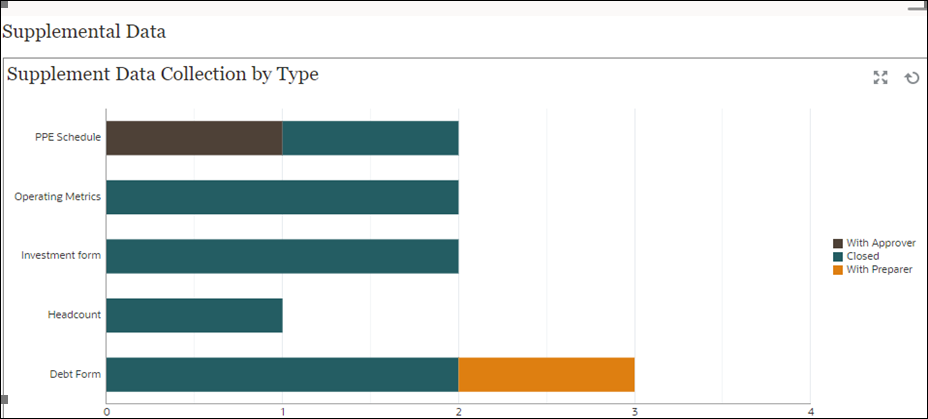
Chart View: Supplement Data Collection by Type
The following example shows the form completion by template type. This allows you to quickly see how the supplemental data collection is progressing by data type.

Within the dashboard, top left view:
- Click the Object Type icon and select Supplemental Data Forms > Default (collection interval).
- Click the View Selector icon and select Chart View.
- Click the Settings icon and specify the following:
- On the Properties tab:
-
Title: Supplement Data Collection by Type
-
Type: Column
- Background: No fill
-
Label Position: No label
- Orientation: Horizontal
- Grid Lines: Select this check box
- Period: Selection
-
- On the Layout tab:
- X-Axis:
- Type: Attribute
- Attribute 1: Template
- Sort: Template from the first drop-down menu and Descending from the second drop-down menu
- Legend (Series):
-
Value: Form
- Aggregation: Count
- Categories: Status (Detailed)
-
- X-Axis:
- On the Axis tab:
- Select Y Axis.
- Minimum: Auto
- Maximum: Auto
-
Major Unit: Fixed
- Minor Unit: Fixed
- On the Legend tab:
- Legend Position: Right
- Palette: Redwood
- Select the default labels for each series
- Select the default colors for each series.
- On the Properties tab:
- Click OK.