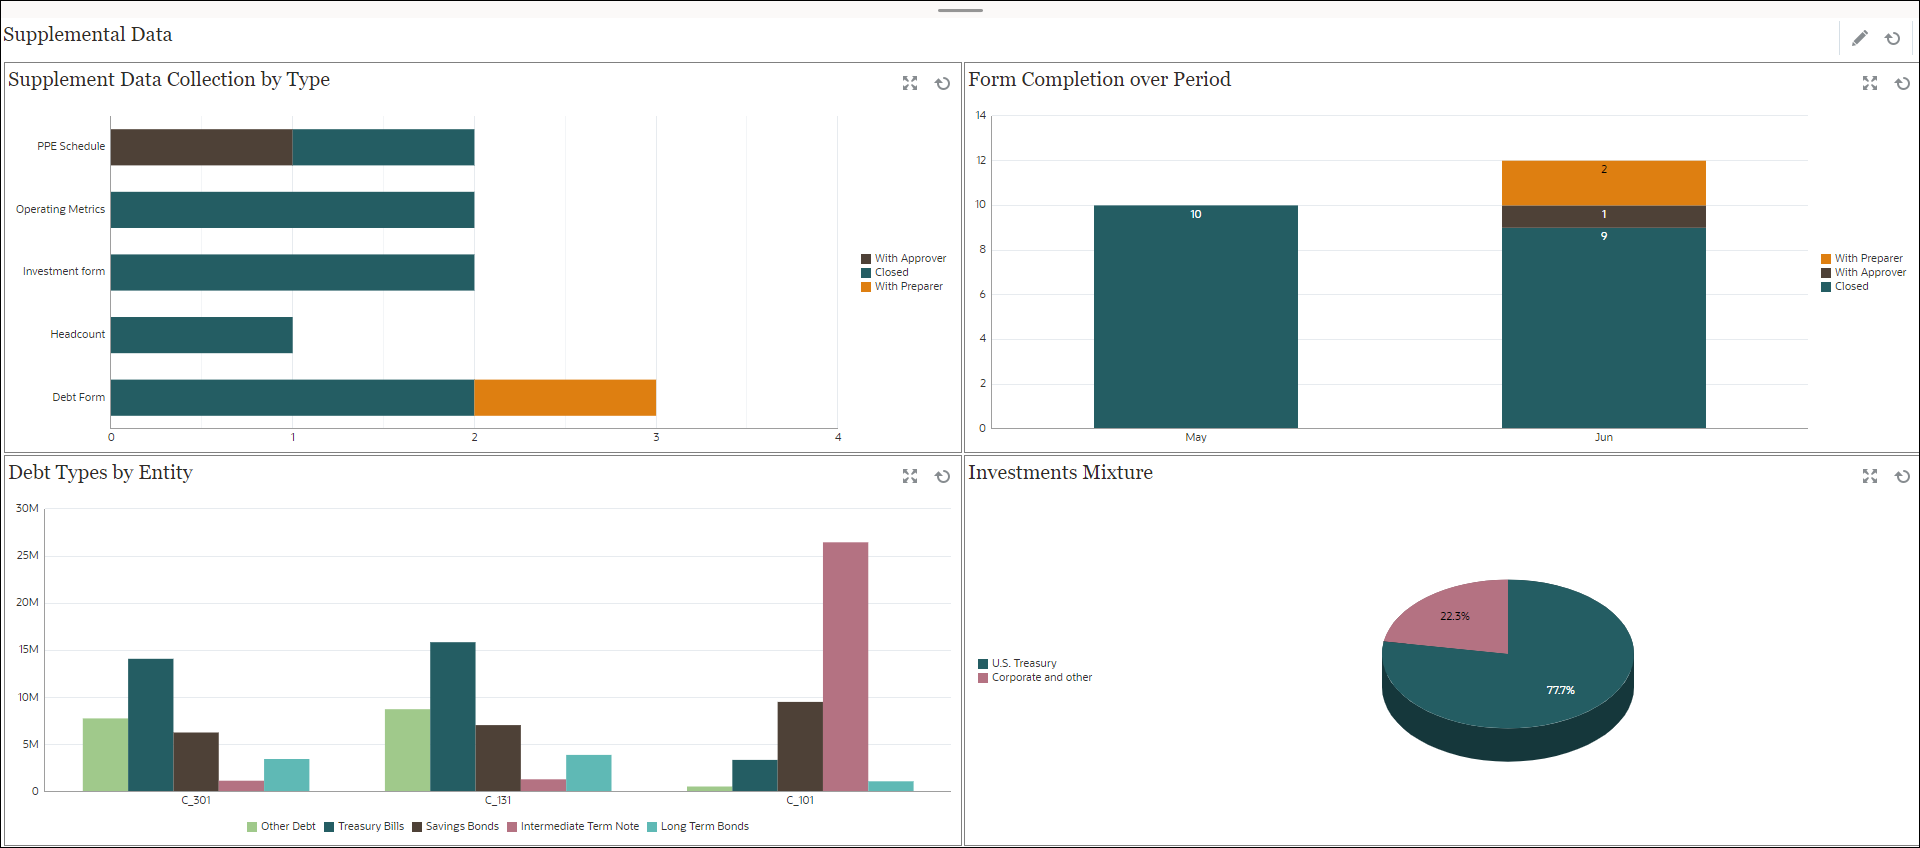
Example: Supplement Data Manager Dashboard
This is an example of a dashboard with views on Supplemental Data Manager Forms and Data. This dashboard is based on sample data and will differ from your usage of Supplemental Data Manager. The views include:
- Chart View: Supplement Data Collection by Type
- Chart View: Form Completion Over Period
- Chart View: Debt Types By Entity
- Chart View: Investments Mixture.
The dashboard is as shown. Click any area, in any view, to drill down into the individual records that comprise that area.

In this example, to create the dashboard:
-
From Home, select Library, and then click Operational Dashboard.
The existing operational dashboards are displayed.
-
Click the New icon to create a new dashboard.
A new dashboard is created with a default name and is opened in a new tab.
-
Click the Settings icon for the dashboard and update the properties on the Properties tab:
- Name: Supplemental Data
- Borders: Select this checkbox
-
Background: No fill
- Layout:
- Grid: Select this check box.
- Horizontal Split: 50
- Vertical Split: 50
-
To create the chart view on the top left, see Chart View: Supplement Data Collection by Type.
-
To create the chart view on the top right, see Chart View: Form Completion Over Period.
- To create the chart view on the bottom left, see Chart View: Debt Types By Entity.
-
To create the chart view on the bottom right, see Chart View: Investments Mixture.
- Click Save to save the dashboard.