Configuring IPM Insights
Configure IPM Insights in Tax Reporting to define the insights that planners see on the Insights dashboard.
You configure IPM Insights by selecting the type of analysis to perform, specifying the slice definitions for analysis, configuring the analysis, and then defining the settings for the insights displayed on the Insights dashboard. You can define insights for as many data intersections as you need. Planners see insights only for slices of data to which they have access.
To associate calendars and events with insight definitions, configure calendars and events first. See Configuring Calendars and Events.
To configure IPM Insights:
- From the Home page, click IPM and then click Configure.
- Click Create.
- In IPM Configurator, on the Types page, enter a name and description.
- Select the types of insights to generate, and then click
Next. You can select as many as you need.
- Forecast Bias Insights. Reveals hidden bias in forecasts submitted by planners by analyzing historical data. Measures the variance or bias between two historical scenarios such as Forecasts and Actuals.
- Anomaly Insights. Detects outlier values that vary widely from other values.

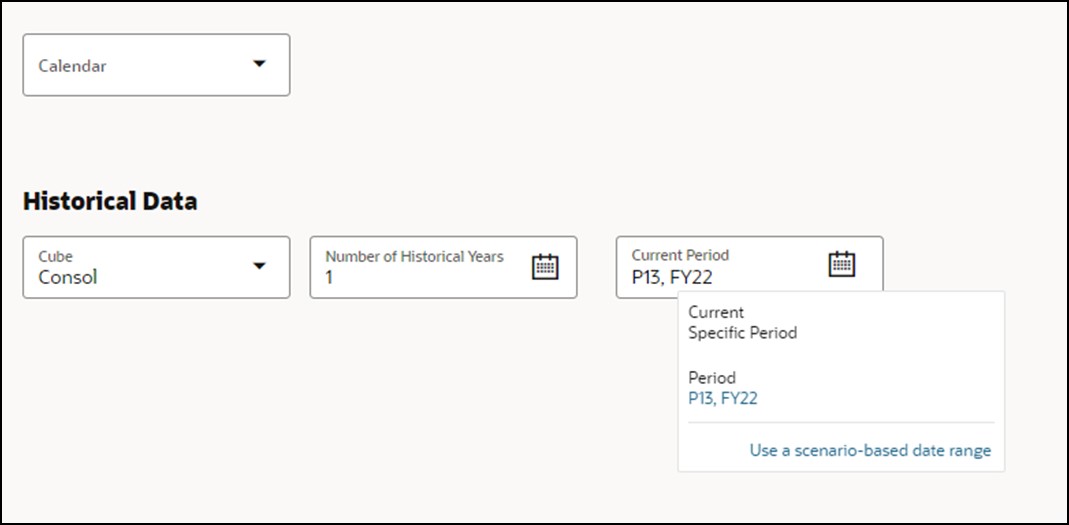
- On the Select Calendar page, select a calendar to use, and
then click Next. When you select a calendar, the
Historical Data section is
populated with details from the selected calendar.
If you don't select a calendar, you can select these options yourself.
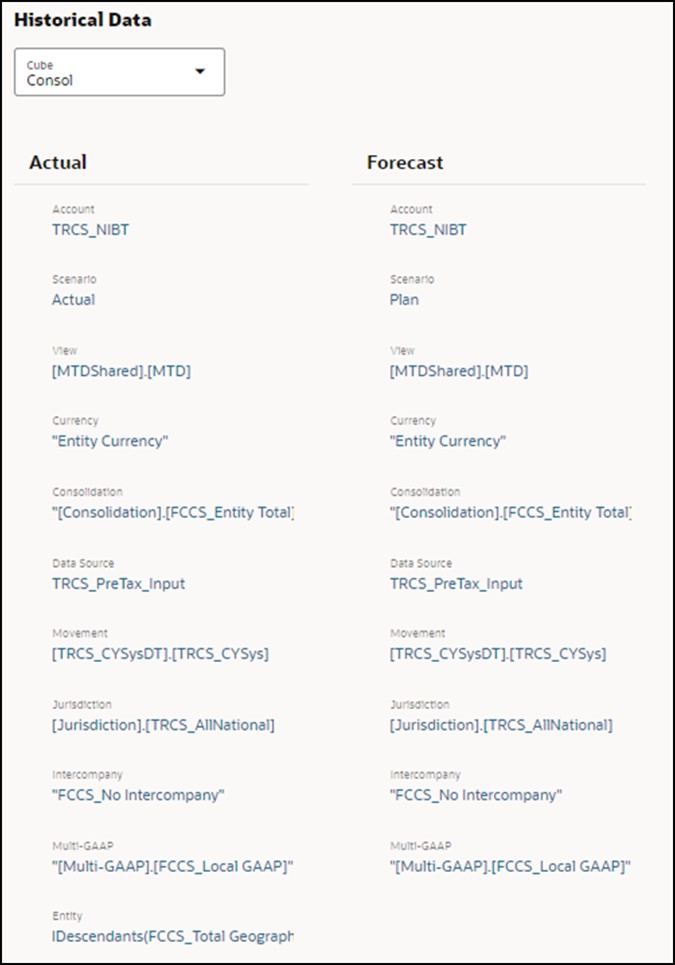
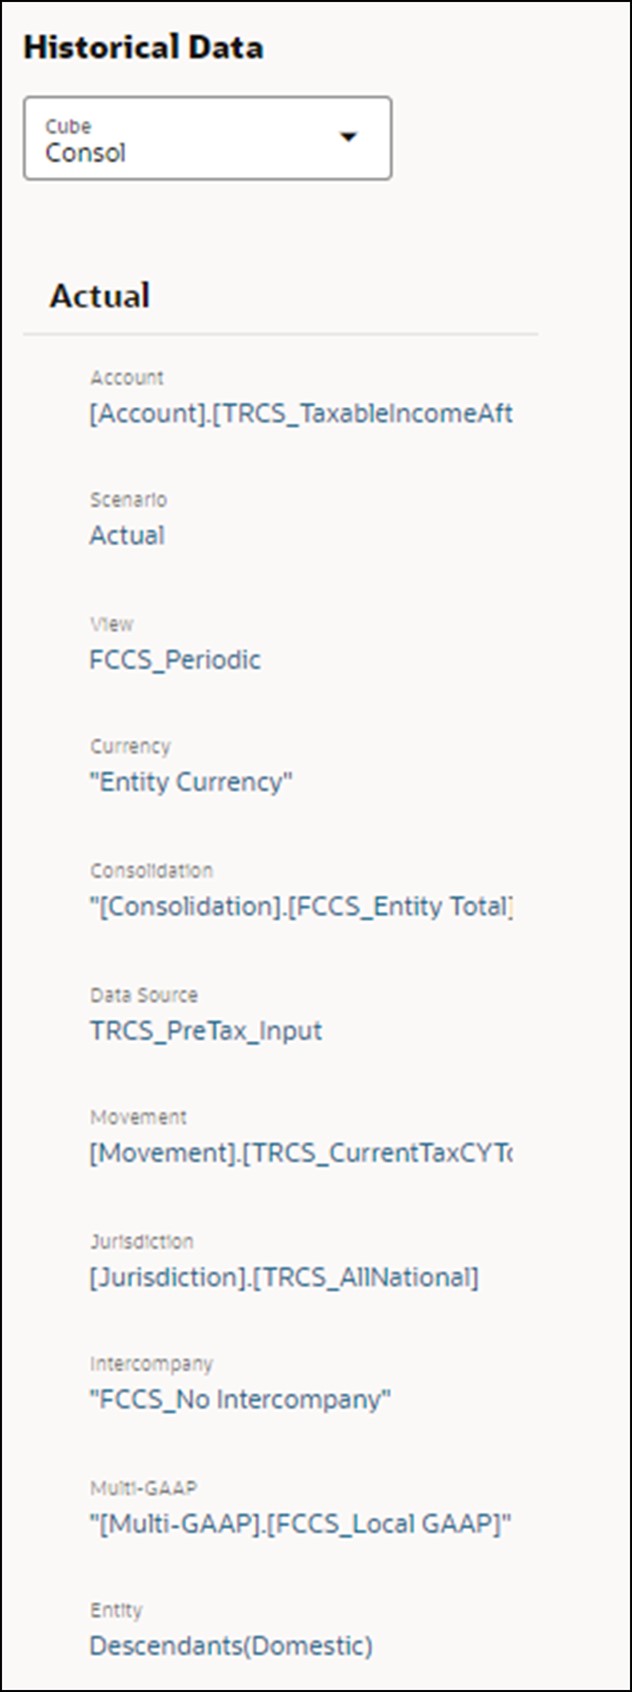
- On the Define Slice page, define the slice of data to analyze
for historical data (Actual and Forecast) , and then click Next.
For example, forecast and variance insight for NIBT account automated value for all the descendants of the Total Geography entity:
For example, anomaly insight for taxable income preTax value between P12 and RTA period:
For considerations on using dynamic calc parent members in the slice definition, see Using Dynamic Calc Members in Insights.
Note: - On the Configure page, configure the insights by defining the
error tolerance and thresholds for insights, and then click
Next. IPM Configurator selects default metrics for
analysis.
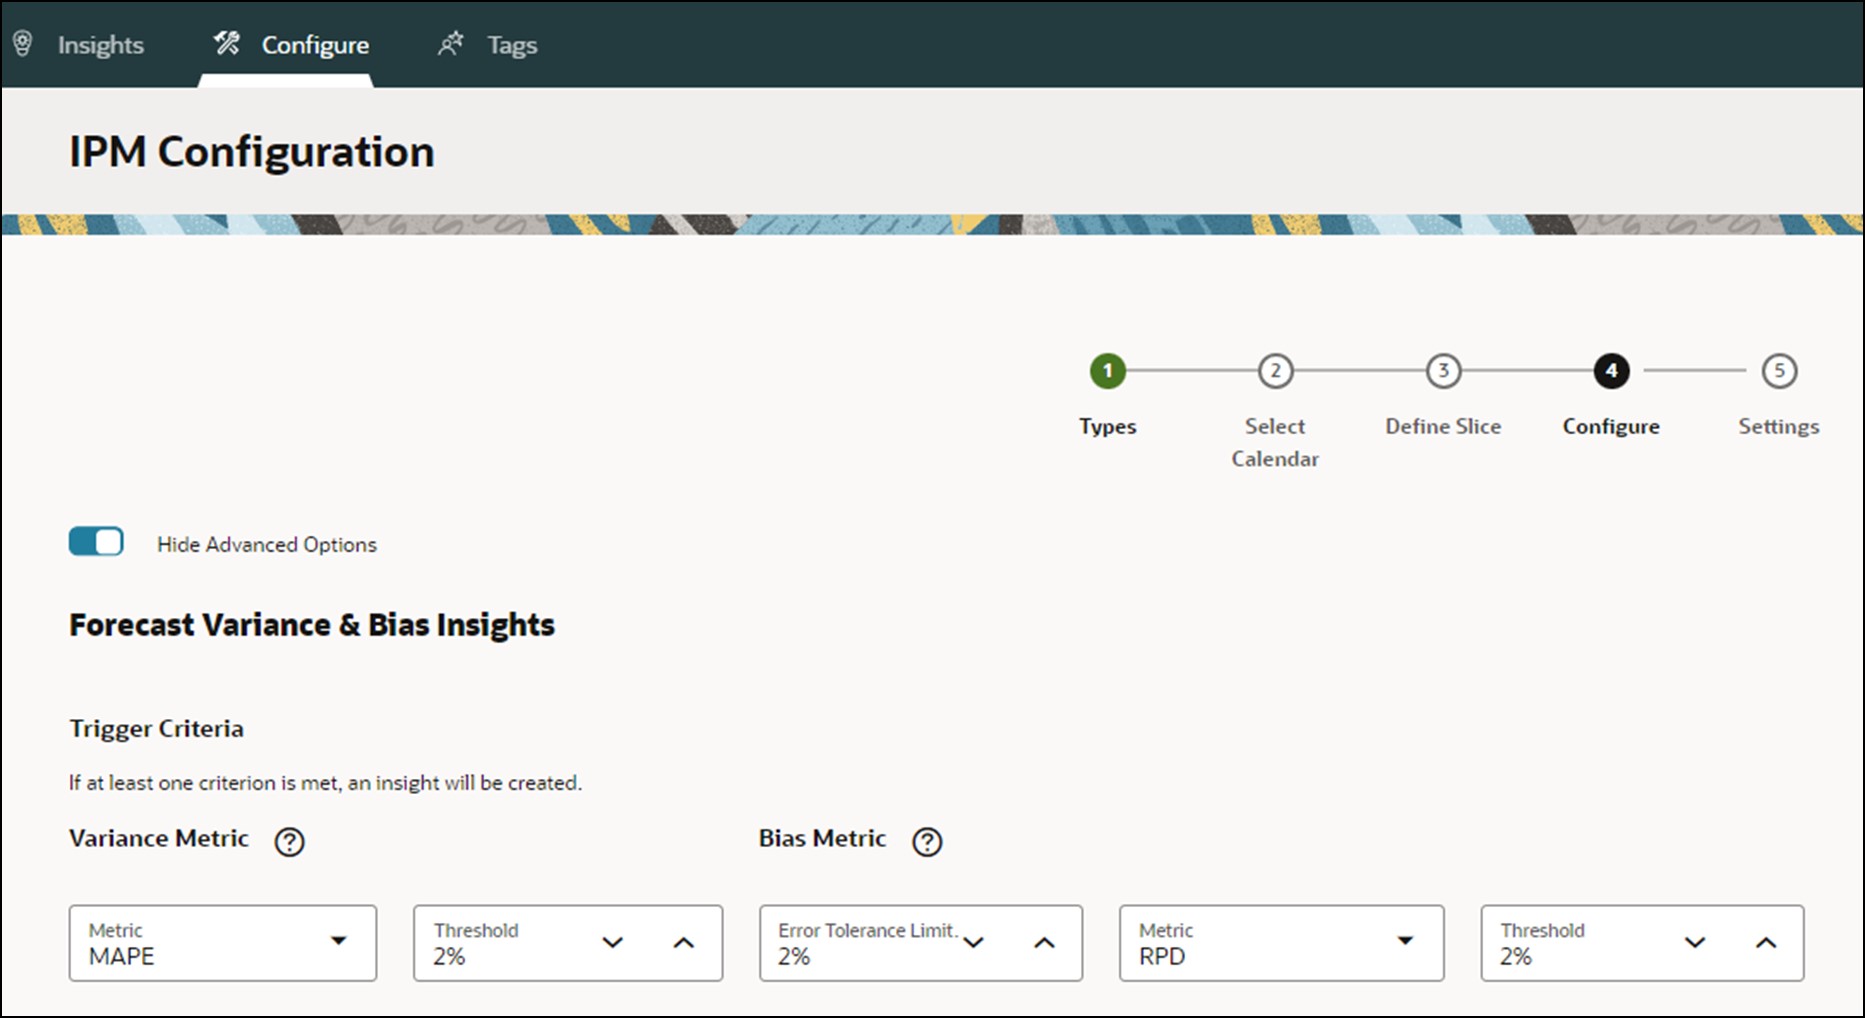
- Forecast Variance & Bias Insights: Select an
error tolerance percentage, which defines the percentage variance between
historical forecasts submitted by planners and actuals that lies within
acceptable range. If the percentage variation crosses the error tolerance
limit, it is considered for bias calculation.
For example, if you enter .05, any difference of 5% or above between historical forecasts and historical actuals is considered a significant variance (and considered either under-forecasting or over-forecasting) and triggers an insight.
You can select or modify the metric and threshold for deviation on the Advanced Options page. See Configuring Additional Insight Settings.
An insight is generated when either deviation or bias crosses the specified threshold.
- Anomaly Insights: Select whether
to include events in the insights calculation.
Select a threshold, which defines the acceptable threshold for Z-score value (the standard deviation from the mean of the values). Anything that is too far from zero (the threshold is usually a Z-score of 3 or -3) should be considered an outlier.
An insight is generated when the specified outlier detection metric crosses the specified threshold.
For example, if you enter 3, anything that is three standard deviations or higher from the mean would be considered an outlier, and would trigger an insight.
If you want to configure additional options, such as selecting the metrics to use, click Show Advanced Options. See Configuring Additional Insight Settings.
- Forecast Variance & Bias Insights: Select an
error tolerance percentage, which defines the percentage variance between
historical forecasts submitted by planners and actuals that lies within
acceptable range. If the percentage variation crosses the error tolerance
limit, it is considered for bias calculation.
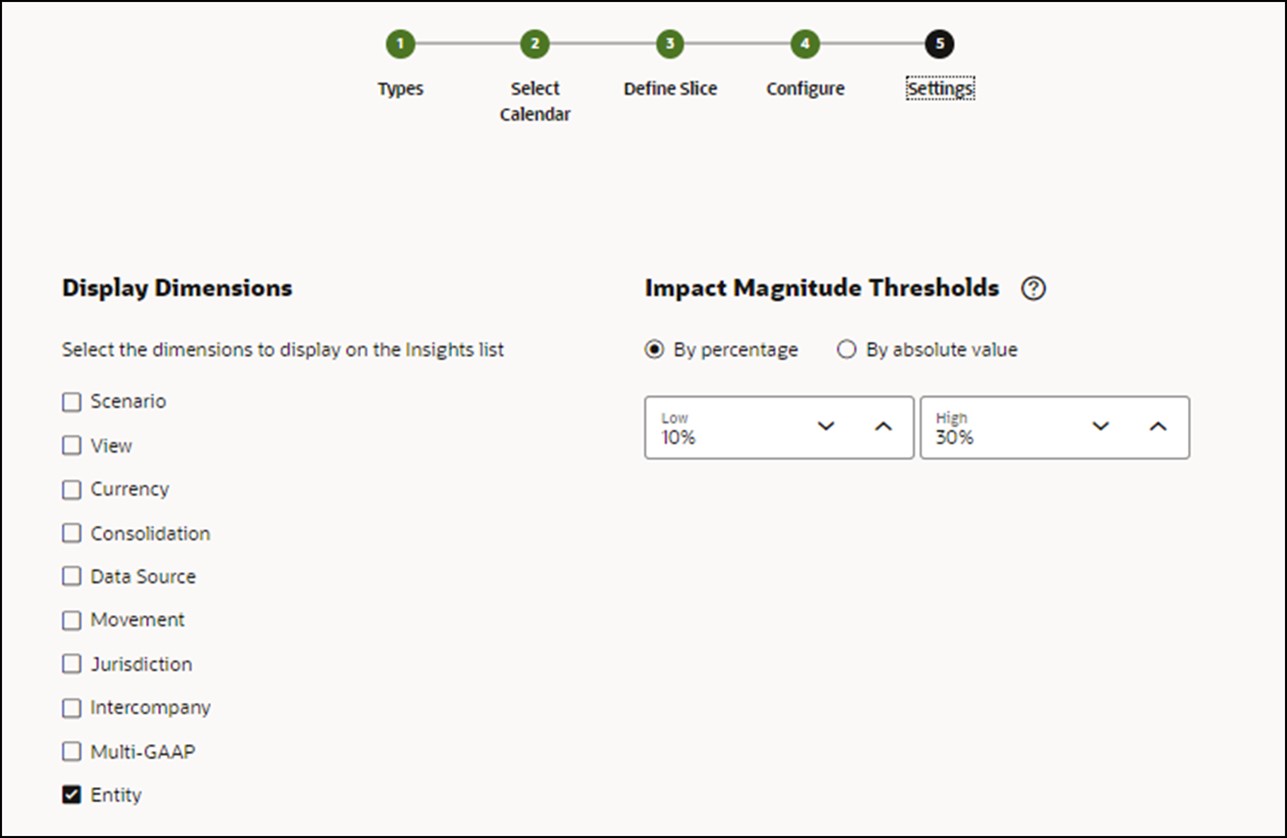
- On the Settings page, configure the settings that define how
to display the insights to planners, and then click Save.
- Display Dimensions: Select the dimensions that planners will use to navigate and analyze the insights. The dimensions you select will display on the Insights dashboard.
- Impact Magnitude Thresholds: When insights are
displayed on the Insights dashboard, this setting categorizes insights into
High, Medium, and Low groups based on the percentage or absolute value
impact calculated for each insight. This helps planners focus attention on
the insights that have more extreme variations.
- Anything less than the low value is in the Low category.
- Anything higher than the high value is in the High category.
- Anything between the low and high value is in the Medium category.
For example, if you specify 30% as the Low threshold and 60% as the High threshold, any insight with a percentage impact less than 30% is in the Low category; any insight with a percentage impact greater than 60% is in the High category. Any insight with a percentage impact between 30% and 60% is in the Medium category.
When entering an absolute value for impact magnitude thresholds, the currency defined in the slice definition applies to the absolute value. If you have multiple currencies defined, you can’t apply an absolute value magnitude threshold; the option is not available.
- Now you're ready to run the insights you configured. See Running and Scheduling Insights.
Insight definitions are saved as global artifacts (in the Auto Predict folder under Global Artifacts) and are backed up with the maintenance snapshot.
About Using Events with Insights
Note the following about using events:
Using events can impact the anomaly insights that are generated. For example, if you create a one-off or repeating event for a specific date where sales spike, and you generate an analysis, anomalies in data for that date are not reported as anomaly insights. Instead, the insight includes the sales spike for that date. If you generate an analysis without events, an anomaly insight is reported for that date.
Videos
| Your Goal | Watch This Video |
|---|---|
| Learn how to configure insights to automate data analysis. Administrators configure insights to define the insights that planners see on the Insights page. You select the type of analysis to perform, specify the slice definitions for analysis, configure the analysis, and then define the settings for the insights displayed on the Insights page. You can run the insight or schedule it to run on a regular basis. |
Tutorials
Tutorials provide instructions with sequenced videos and documentation to help you learn a topic.
| Your Goal | Learn How |
|---|---|
| Learn how to configure IPM Insights by selecting the type of analysis to perform, specifying the slice definitions for analysis, configuring the analysis, and then defining the settings for the insights displayed on the Insights dashboard. You can define insights for as many data intersections as you need. Planners see insights only for slices of data to which they have access. |