Configuration and Administration
Business Monitor
The Business Monitor monitors business objects based on predefined saved queries/saved searches and let's you see when records match the search criteria defined in the saved query. Before you can use the business monitor you must configure it to contain the saved queries/searches for the business objects that you want to monitor. Also you must enable the business monitor in your user preferences.
- Click the Business Monitor icon
 to display the business monitor.
The Business Monitor page lists the saved queries that were configured for each query type (or business object) and the number of resulting records that exist based on the search criteria defined in the saved query.
The top of the page shows the Time of Last Refresh and Time of Next Refresh based on the business monitor configuration you are using. These values are automatically updated if you have the Business Monitor Auto-Refresh option turned on by setting the glog.webserver.businessMonitor.autoRefresh property. To set the actual refresh interval, enter a value in the Refresh Interval field when creating or editing the business monitor. Otherwise, only the Time of Last Refresh appears and it is updated after you perform a manual refresh by clicking the  icon.
icon.
If you have new results and the business monitor is open, a red circle appears on the icon to indicate that records in any of your saved queries have changed.
Saved Query Details
Your saved queries are displayed under the business object section to which they belong.
Under each object heading, you see the saved query ID followed by number of matching records/number of previous matching. For example under the Order Base object, you could see a query ID of MYTEMPLATE (11/11) as shown here:
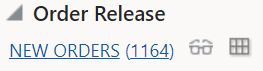
- Click on the saved query ID (MYTEMPLATE) or the number of matching link (the first 11 in 11/11) to view the results of the saved query.
- Click the View Search Details icon (
 ) to display the Saved Query view page. On the Saved Query view page, you can view query details or click Edit to modify it.
 - Click the
 (WORKBENCH: <layout ID>) icon to display the Enhanced Workbench Layout in a pop-up window.
Business Objects
You can also display the records that result from the query by clicking the saved query ID link or the Number of Matching Records value link.
Related Topics
If you have any questions or comments about this documentation page, please Contact Oracle Documentation. ![]()