Fetch and Store the Error Counts from Intermediate Table
The mechanism of running the new schedule jobs per integration recipe and fetching the error counts data for the integration type is as follows:
- When the schedule job is run for the first time, it fetches error count for the last 1 hour, by default.
- During the run, the respective job type queries to fetch the error counts
per integration recipe.
For example, when the receipt advice/confirmation schedule job is run, it fetches errors from WMS and OIC (PO, ASN, PO_RMA_TO, Supplier_ASN, and RMA) for the runtime from all the facilities the user is eligible for.
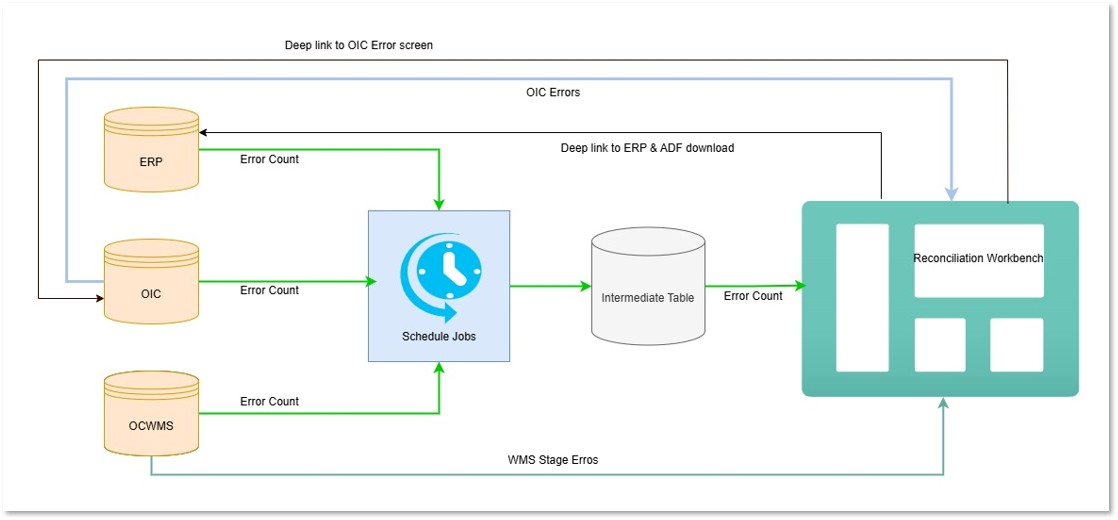
- After fetching, the intermediate table captures these records per runtime
and process it to the Reconciliation dashboard. Note: There's no auto purge of the records, but the table stores the error counts.
Use Case 1: Fetching Error Counts on Running the Schedule Jobs for the First Time
- Schedule job runs on 11th April at 6:00 AM
Schedule Job Run
Sub type po asn po_rma_to supplier_asn rma Number of errors (till the run ts) 6 3 8 4 3 Number of errors last 1 hour 1 2 1 1 1 - The Intermediate table captures the error as follows:
Schedule Job Run
source_system integration_type sub_type company facility error count run_ts WMS receipt_advice po ABC ABC01 1 11-04-2025 06:00:00 WMS receipt_advice asn ABC ABC01 2 11-04-2025 06:00:00 OIC receipt_advice po_rma_to ABC ABC01 1 11-04-2025 06:00:00 OIC receipt_advice supplier_asn ABC ABC01 1 11-04-2025 06:00:00 OIC receipt_advice rma ABC ABC01 1 11-04-2025 06:00:00
Use Case 2: Fetching Error Counts When the Schedule Job is Run in Interval/ Crontab
- Let’s say, the schedule job interval is set to 1 hour and there are few errors
that take place between the two run ts as follows:
Schedule Job Run
Sub type po asn po_rma_to supplier_asn rma Number of errors fetched at 6:00AM 1 2 1 1 1 Number of errors created between 6:00 AM to 7:00AM 1 0 0 1 0 - Intermediate table captures the error as follows:
Schedule Job Run
source_system integration_type sub_type company facility error count run_ts WMS receipt_advice po ABC ABC01 1 11-04-2025 06:00 WMS receipt_advice asn ABC ABC01 2 11-04-2025 06:00 OIC receipt_advice po_rma_to ABC ABC01 1 11-04-2025 06:00 OIC receipt_advice supplier_asn ABC ABC01 1 11-04-2025 06:00 OIC receipt_advice rma ABC ABC01 1 11-04-2025 06:00 WMS receipt_advice po ABC ABC01 1 11-04-2025 07:00 WMS receipt_advice asn ABC ABC01 0 11-04-2025 07:00 OIC receipt_advice po_rma_to ABC ABC01 0 11-04-2025 07:00 OIC receipt_advice supplier_asn ABC ABC01 1 11-04-2025 07:00 OIC receipt_advice rma ABC ABC01 0 11-04-2025 07:00 Note: In case the schedule jobs run with a schedule type as crontab (say every day at 10:00:00 hrs), then the schedule job should fetch all the errors created between the previous and the next run (from previous day 10:00:00 hrs to the next day 9:59:59 hrs).Note: If there is a previous run, the schedule job will check for the errors since for that time (irrelevant to how far in the past the previous run was). Even if the scheduler is down, the system will check for the previous run TS and fetch the error counts for that duration (previous run ts to the current run ts). This count will be plotted in the previous hour window.In the normal scenario, the job works based on the interval/crontab as planned. If the interval is every 4 hours, the data points will be every four hours. The plot shown on the UI is displayed for every 4 hours and is plotted in the previous hour. If there is an outage, there will be a spike for the hour prior to the time it restarted.
For example: If the schedule starts at 6:00 AM and runs every 4 hours of interval, then the errors should be fetched as follows:- Case 1: For the first time at 6:00 AM, the error counts is be fetched from 5:00 AM to 6:00 AM and is plotted at 6:00 AM point on the X-axis.
- Case 2: Considering the run interval is 4 hours, then the next run will be at 10:00 AM the same day. The error counts are fetched from 6:00 AM to 10:00 AM and is plotted at 10:00 AM point on the X-axis.
- Case 3: After plotting the graph at 10AM for last run and if the schedule job is down for various factors, then the graph is plotted at 02:00 PM of the next day. The error counts are fetched from 10:00 AM to 02:00 PM and is plotted at 2:00 PM the next day point on the X-axis.