Optimize Pick Locations with Reslotting Workbench
The Reslotting Workbench allows you to realign inventory pick locations based on current Item velocity (ABC rankings). It identifies mismatches between item velocity and location rankings and generates replenishment tasks to re-slot the material. This helps to maintain optimal pick paths, reduce manual effort, and improve picking efficiency.
Reslotting Workbench UI
The intuitive Reslotting Workbench (UI) is designed to help warehouses optimize inventory placement based on product velocity, seasonality, and demand patterns. This UI helps improve operational efficiency by reducing picker travel times and congestion with smarter inventory placement.
You can view important location and item details and Key Performance Indicators (KPIs) all in one Workbench style display:
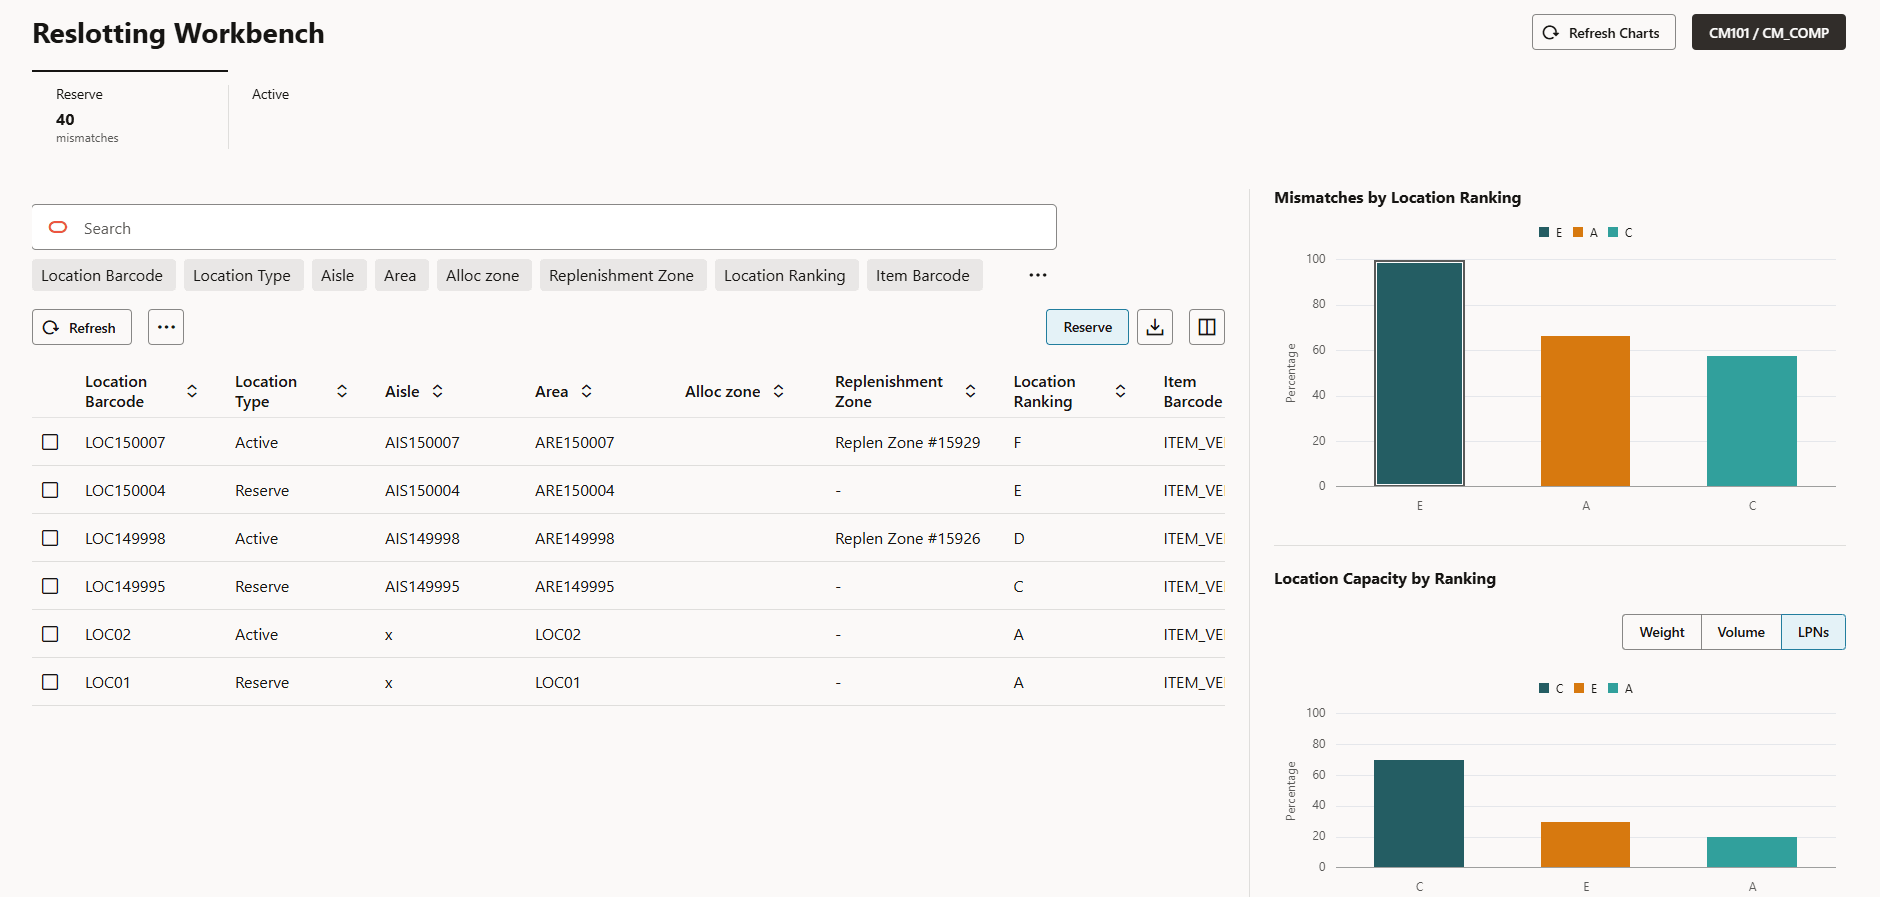
On the left side, the UI includes a user-friendly data grid where you can Search, filter, and sort by critical fields such as Location, Ranking, Item, Facility, Inventory Cost, and more.
Viewing the Graphs
When you are viewing the Workbench Graph KPIs / Location Capacity by Ranking, you can toggle between 3 metrics.
- You can view Active Locations metrics by: Volume, Weight, Units
- You can view Reserve Locations metrics by: Volume, Weight, LPNs
Initiate Reslot Movement Action Button
The Initiate Reslot Movement action button will create a request in order to send the selected records to a drop location. This button is permission-based.
Generate New Report
You can click Generate New Report to run a new report with all of the Reslotting details from the Workbench UI for further analysis. You will see a buffering icon while the new report is being generated. You can click the CSV Export button to download to CSV format.
Location Ranking Field in Location UI/Patch API and Input Interface
You can also use the Location Capacity Metrics GET API to generate the Reslotting Workbench metrics in a stacked bar chart format. This will display Location data such as volume, weight, and LPNs.
Configuration for Velocity Code and Location Ranking
To configure an item’s Velocity Code Ranking, use the Item-Facility Velocity Code field in the Item Facility UI. This value can be set Manually, via Init Stage API, or Input Interface upload.
Velocity Code Field
To configure an item's Location Ranking, use the newly introduced Location Ranking field on the Locations UI. This value can be set Manually, via Init Stage API, or Input Interface upload.
Location Ranking Field
FOR EXAMPLE:
- Item Velocity Codes: A, B, C, D and Location Rankings: A, B, C ,D or
- Item Velocities: Hot, Fast, Medium, Slow and Location Rankings: Hot, Fast, Medium, Slow.