Employee Timeline Metrics
The legacy Daily Report in WFM has been deprecated and replaced with Daily Timeline on Employee Timeline Metrics tab.
Daily Timeline
This chart provides a visual representation of the number of hours employees have spent in the facility, on breaks, and across different work areas on the selected date.
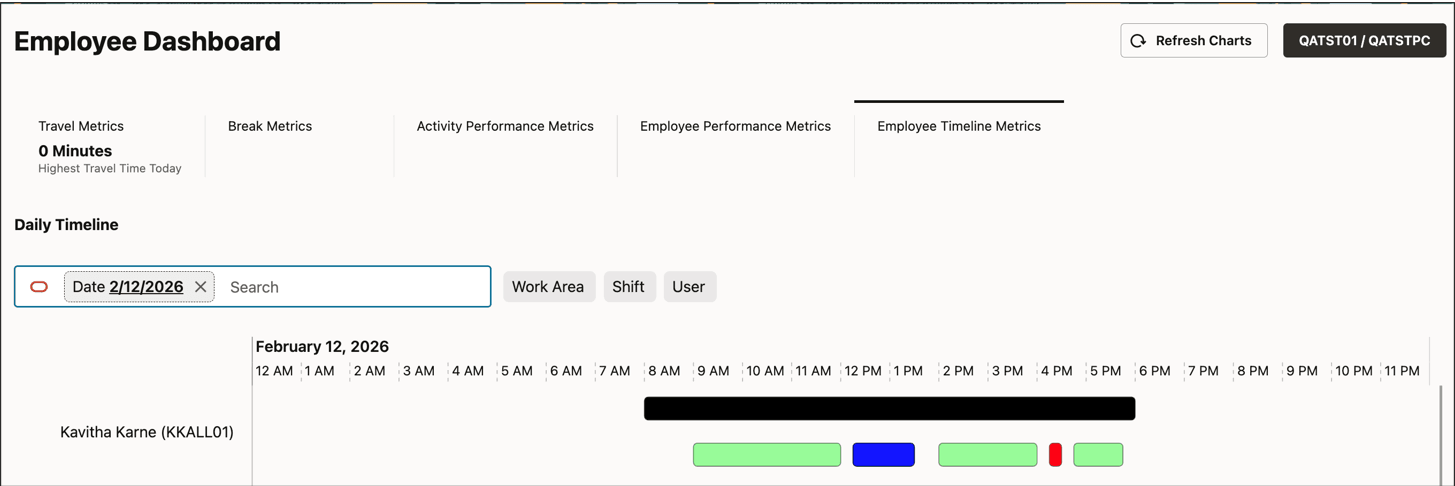
The chart displays horizontal bars for each employee, the top black bar indicating the time spent in facility, and the colored bars indicating time spent in work areas and breaks.
Time spent in facility is represented as a black bar and this color cannot be changed. However, work areas can be configured using different colors in the work area view. This makes it convenient for supervisors to visually interpret this report. Breaks can also be configured using different colors in the break view.
Hovering over each bar provides the exact start and stop times along with the status of the entity. CLOSED indicates that employees have clocked out of such entities and OPEN indicates that employees have not yet clocked out. For OPEN entities the current facility time is used as end time to display bars, however the status of the entity shows as OPEN. Apart from that additional information is displayed depending on each entity as described below.
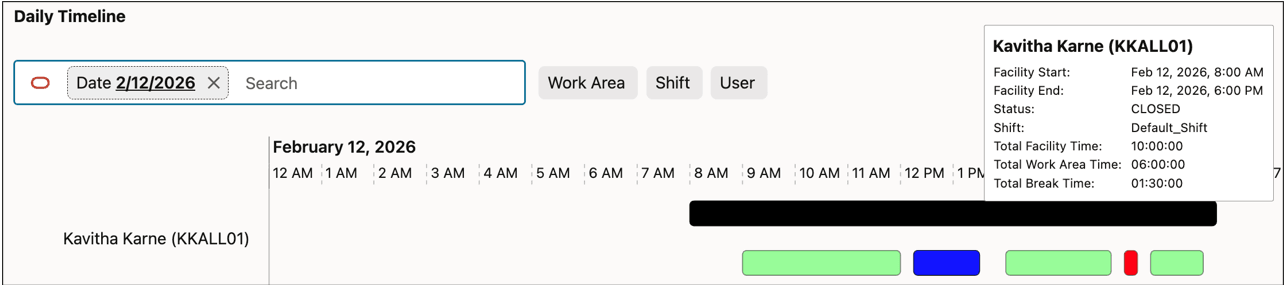
Hovering over the facility bar displays the shift, total facility, break and work area time.
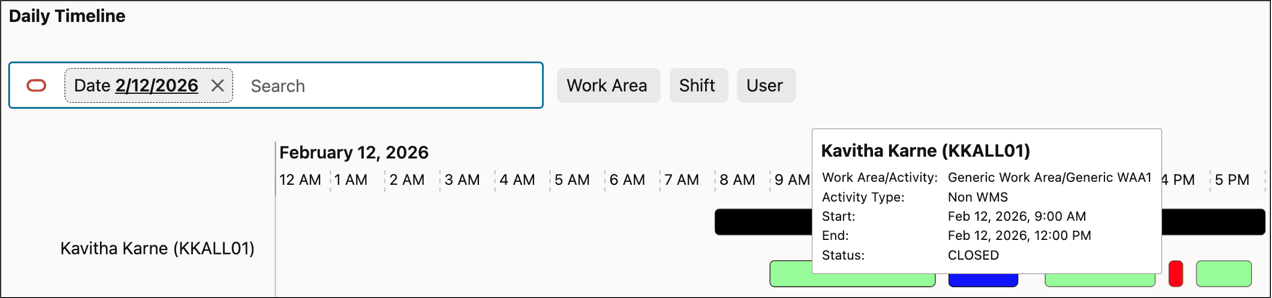
Hovering over the work area bar, displays the activity performed by the employee in that work area along with the type of activity.
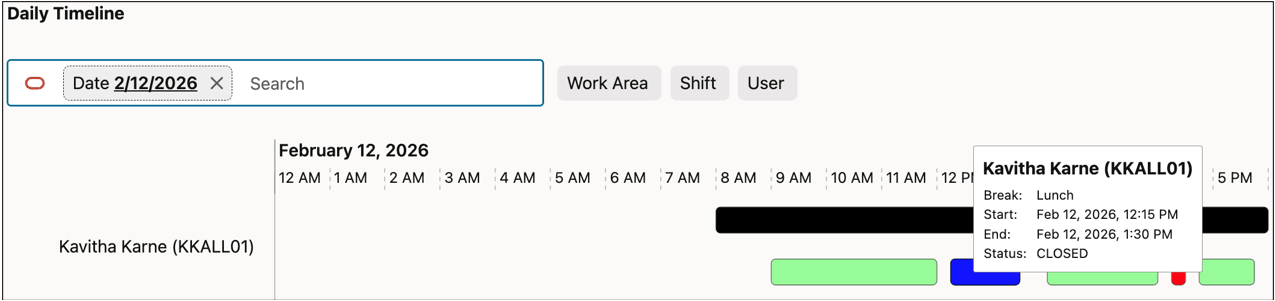
Hovering over the break bar, displays the break taken by the employee.
Currently the color for any Work Area that is tied to WMS Activity is always blue. This will be addressed in upcoming patch/release".