Travel Metrics
The travel metrics tab provides deeper insights into employee movement within the warehouse. This tab features three charts with toggle options to view trends by current day, last 7 days or last 30 days
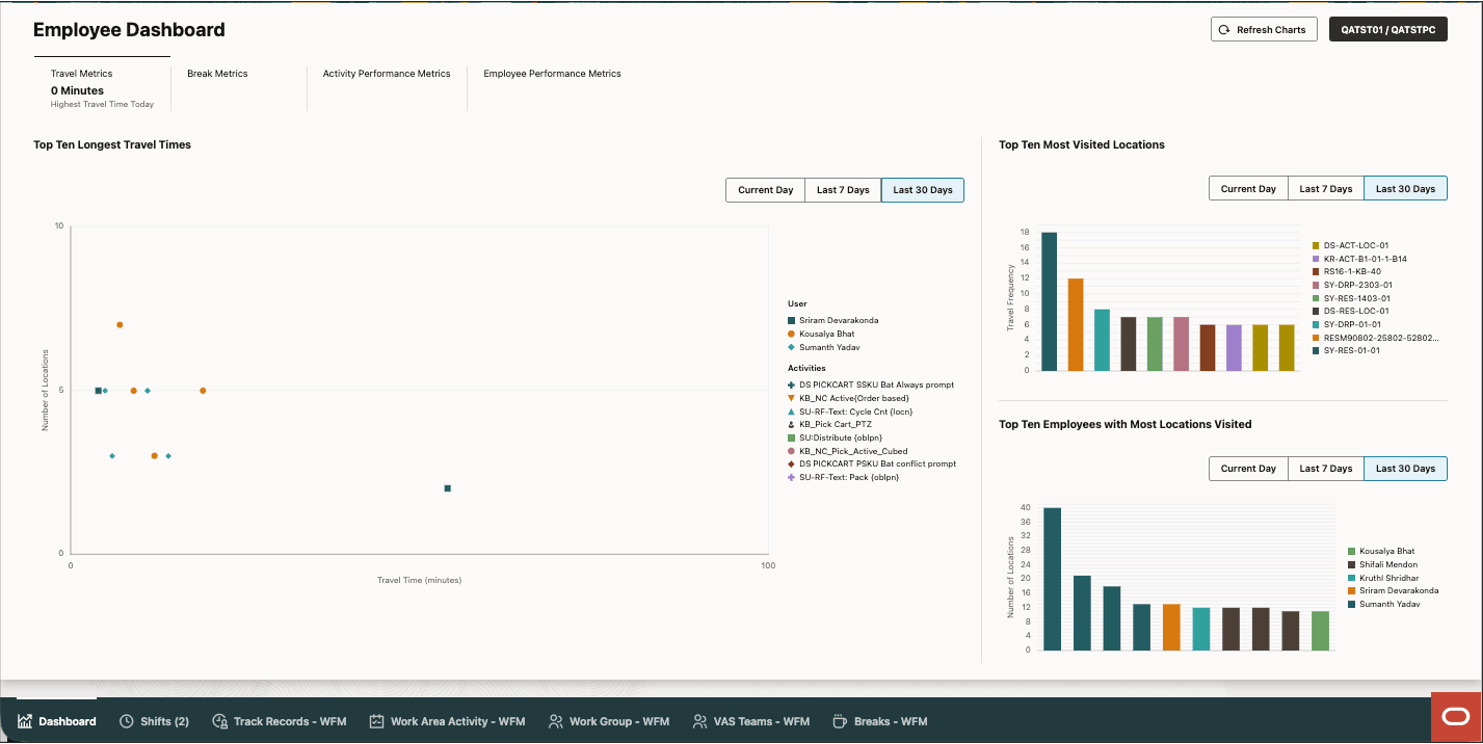
Top Ten Longest Travel Times
This scatter chart highlights the top 10 longest employee travel times during the selected period, helping to quickly identify travel-intensive activities. It also illustrates the correlation between the number of locations (x-axis) and travel time (y-axis). Hovering over data points provides additional details, including the activity performed, the employee, travel time, the number of locations visited and date.
Top Ten Most Visited Locations
This bar chart displays the top 10 most visited warehouse locations, helping to identify high-traffic areas within the facility. Hovering over the data points provides additional details including the location, travel frequency, and date.
Top Ten Employees with Most Visited Locations
This bar chart showcases the top 10 employees who have visited the highest number of locations enabling quick identification of highly mobile employees and supporting workforce planning. Hovering over the data points provides additional details including the employee, number of locations visited and date.