Monitor Microservices
From the Services option in the left-navigation pane, click any of the Microservices: Administration Service, Distribution Service, Receiver Service, or the Performance Metrics Service. The Metrics page is displayed, which displays the metrics for Process Performance, Thread Performance, Status and Configuration, and Performance Metrics Statistics (Performance Metrics Service only).
Note:
The diagrams in this topic are a sample from the Performance Metrics Service monitoring information. The other microservices also display similar information.-
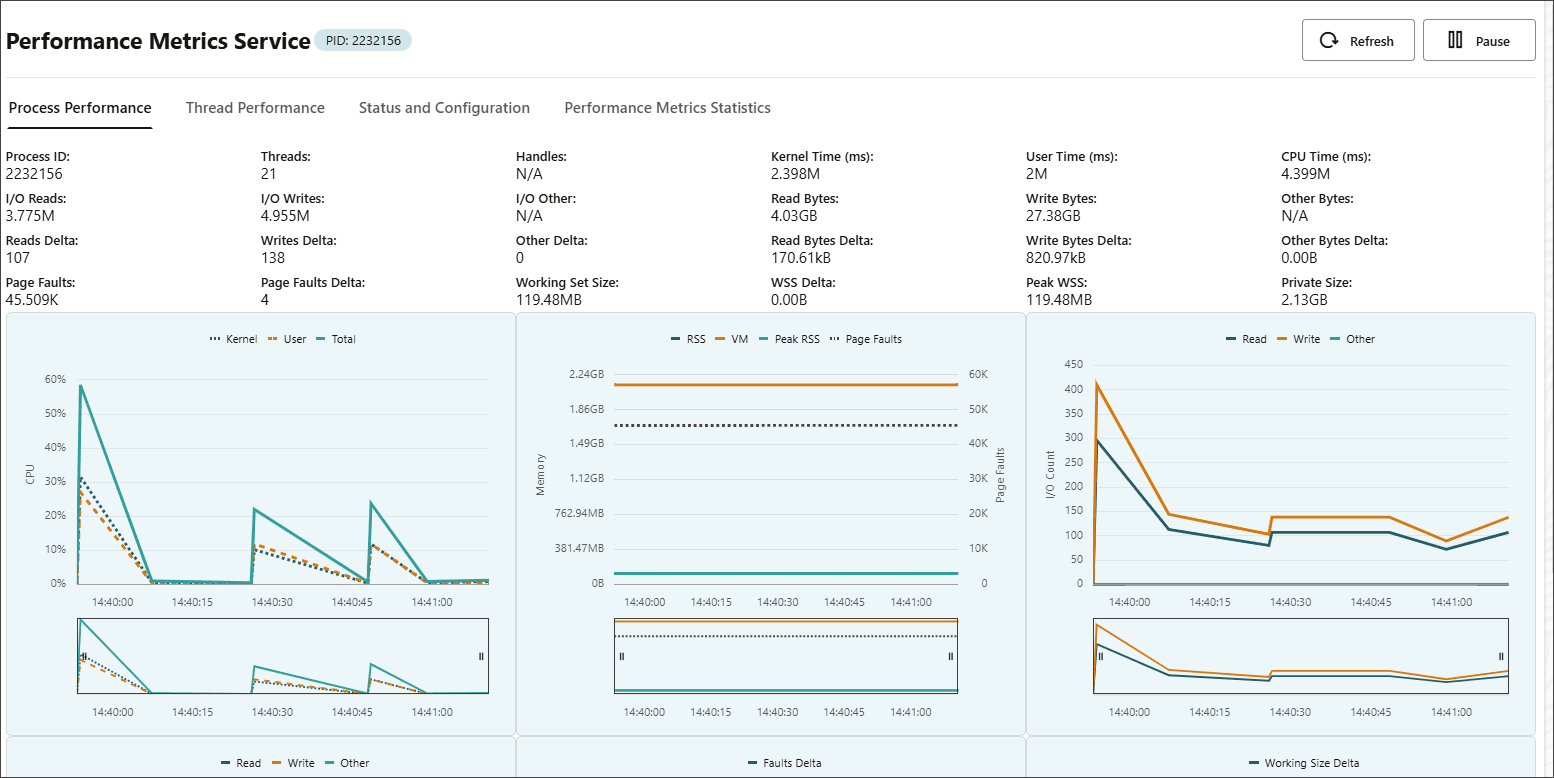
Process Performance tab displays process related details including the process ID, number of threads, CPU time, I/O Read, I/O Writes and many others.

-
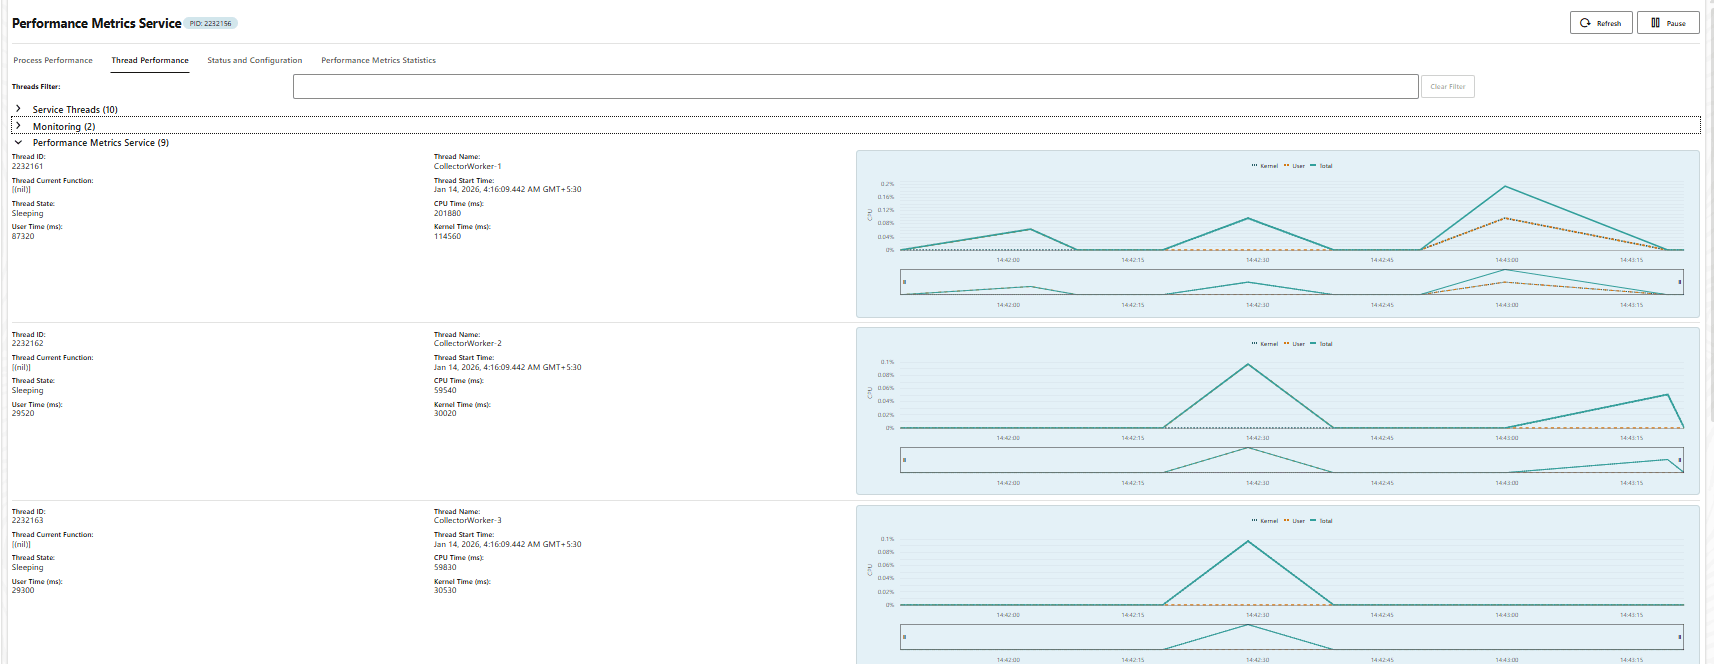
Thread Performance tab thread level data at the Service Thread level, Monitoring level to show the threads that are being monitored, and the Performance Metrics Service thread monitoring.

-
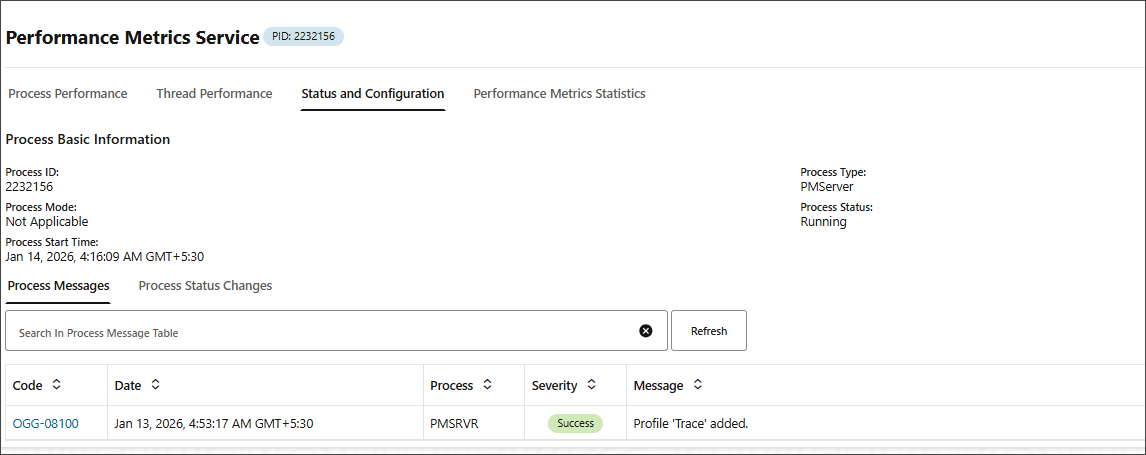
Status and Configuration tab displays the process messages and process status changes.

-
Performance Metrics Statistics tab displays data for the Performance Metrics Service, including packets received, bytes of data received, database type and others.

Protocols for Performance Monitoring for Different Operating Systems
Oracle GoldenGate uses Unix Domain Sockets (UDS) for UNIX-based and Named Pipes (for Windows) techniques to send monitoring points from Extract, Replicat, and other processes to the Performance Monitoring Service of the deployment.
For each deployment, the Performance Metrics Service is local to the host. This makes it more secure to use the Unix Domain Sockets (UDS) protocol or Named Pipes technique in Windows for Inter-process Communication (IPC) with the service and improve overall performance. Named Pipes utilizes a unique file system called NPFS (Named Pipe filesystem) that allows managing the security as any file subject using security checks for file access.
-
UDS is available with Oracle and non-Oracle databases. The UDS file is located in the
$OGG_HOME/var/tempdirectory of the deployment. -
The standard location for named pipes in Windows is
\\ServerName\pipe\PipeName (\\ServerName\pipe\).
Recover from Datastore Corruption
The Performance Metrics Service collects and manages operational metrics related to the
health and performance of replication processes. The dirbdb directory
stores essential checkpoint information. If contents of this directory are missing or
corrupted, then the Performance Metric Service may not be able to collect performance
data.
To resolve this issue, you can disable the Performance Metrics Service from the Service Manager or the Admin Client, and then enable it again. This will recreate corrupted BDB files and resolve the issue.