4.6.11 Managing Pivot Reports
Pivot reports transpose rows into columns to generate results in a crosstab format.
Select pivot columns and rows and then provide the functions to be represented in the pivot report. Once created, pivot reports display a new icon in the search bar.
- Creating a Pivot Report
Create a pivot report by opening the Pivot dialog from the Actions menu. - Editing a Pivot Report
Edit a pivot report by clicking the Edit Pivot filter in an interactive report and opening the Pivot dialog. - Deleting a Pivot Report
Remove a pivot report from an interactive report in the Pivot dialog.
Parent topic: Customizing an Interactive Report Using the Actions Menu
4.6.11.1 Creating a Pivot Report
Create a pivot report by opening the Pivot dialog from the Actions menu.
To create a pivot report:
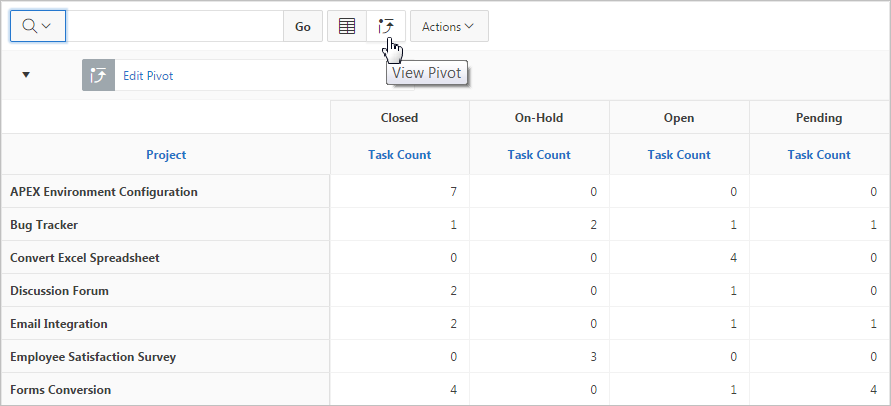
The Search Bar now contains at least two icons, including View Report and View Pivot. Click these icons to toggle between the report view and the pivot view.
The following example shows a Pivot report that displays the number of closed, on-hold, open, and pending tasks associated with each project.
Parent topic: Managing Pivot Reports
4.6.11.2 Editing a Pivot Report
Edit a pivot report by clicking the Edit Pivot filter in an interactive report and opening the Pivot dialog.
To edit a pivot report:
Parent topic: Managing Pivot Reports
4.6.11.3 Deleting a Pivot Report
Remove a pivot report from an interactive report in the Pivot dialog.
To delete a pivot report:
Tip:
You can also click the Remove Pivot icon to the right of the Edit Pivot filter.
Parent topic: Managing Pivot Reports
