Managing Pivot Reports
Pivot reports transpose rows into columns to generate results in a crosstab format.
Select pivot columns and rows and then provide the functions to be represented in the pivot report. Once created, pivot reports display a new icon in the search bar.
- Creating a Pivot Report
Create a pivot report by opening the Pivot dialog from the Actions menu. - Editing a Pivot Report
Edit a pivot report by clicking the Edit Pivot filter in an interactive report and opening the Pivot dialog. - Deleting a Pivot Report
Remove a pivot report from an interactive report in the Pivot dialog.
Parent topic: Customizing an Interactive Report Using the Actions Menu
Creating a Pivot Report
Create a pivot report by opening the Pivot dialog from the Actions menu.
To create a pivot report:
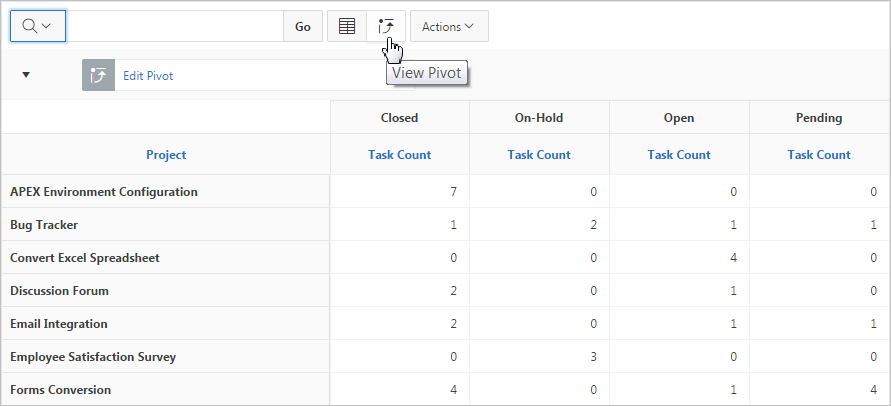
The Search Bar now contains two icons: View Report and View Pivot. Click these icons to toggle between the report view and the pivot view.
The following example shows a Pivot report that displays the number of closed, on-hold, open, and pending tasks associated with each project.
Parent topic: Managing Pivot Reports
Editing a Pivot Report
Edit a pivot report by clicking the Edit Pivot filter in an interactive report and opening the Pivot dialog.
To edit a pivot report:
Parent topic: Managing Pivot Reports
Deleting a Pivot Report
Remove a pivot report from an interactive report in the Pivot dialog.
To delete a pivot report:
Tip:
You can also click the Remove Pivot icon to the right of the Edit Pivot filter.
Parent topic: Managing Pivot Reports
