Understanding Report Types
When creating a database application, developers can create four basic report types: interactive grid, interactive report, report on form on table, or a classic report.
Tip:
When creating reports for mobile devices, Oracle recommends creating components that are optimized to work well on mobile devices. To learn more, see "Creating Applications for Mobile Devices."
Interactive Grid
An interactive grid presents users a set of data in a searchable, customizable report. Functionally, an interactive grid includes most customization capabilities available in interactive reports plus the ability to rearrange the report interactively using the mouse and keyboard.
Users can lock, hide, filter, freeze, highlight, sort individual columns, and create control breaks on specific columns using the Actions and Column Heading menus. Advanced users can also define breaks and aggregations against columns. Users can also directly customize the appearance of an interactive grid. Users can use the mouse and keyboard to resize the width of a column and drag and drop columns into different places in the grid. Once customized, the report can be saved as either a private or public report. Both the Create Application Wizard and Create Page Wizard support the creation of interactive grids.
The following is an example of an interactive grid.
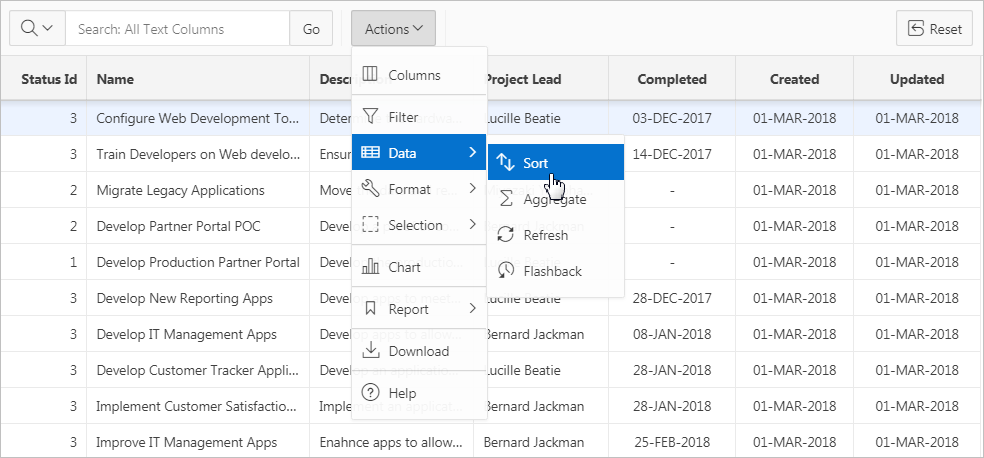
Description of the illustration rpt_ig.png
Editable Interactive Grid
Developers have the option of making an interactive grid editable. In an editable interactive grid, users can also add to, modify, and refresh the data set directly on the page. Editable interactive grids include additional controls. A Row Actions menu displays at the start of each row and enables users to add, edit, and refresh rows. Edit, Save, and Add Row buttons also display to the right of the Actions menu.
The following is an example of an editable interactive grid.
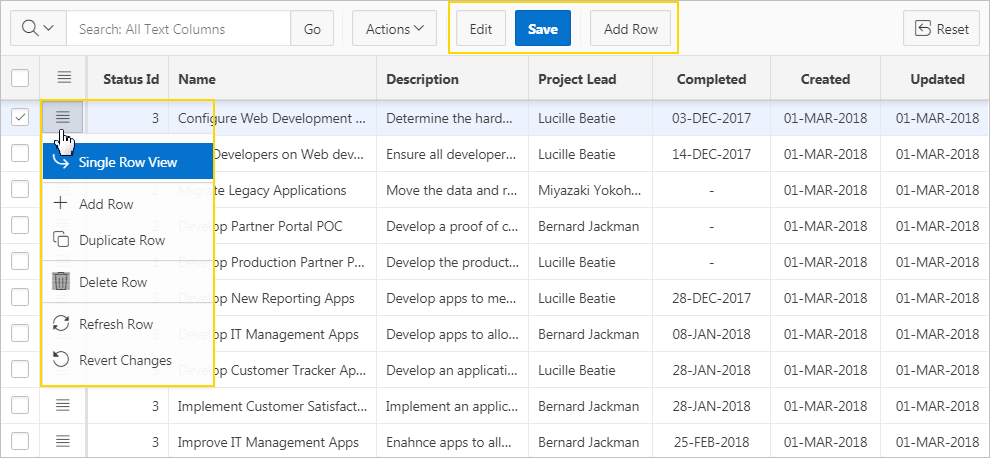
Description of the illustration ig_editable.png
Interactive Report
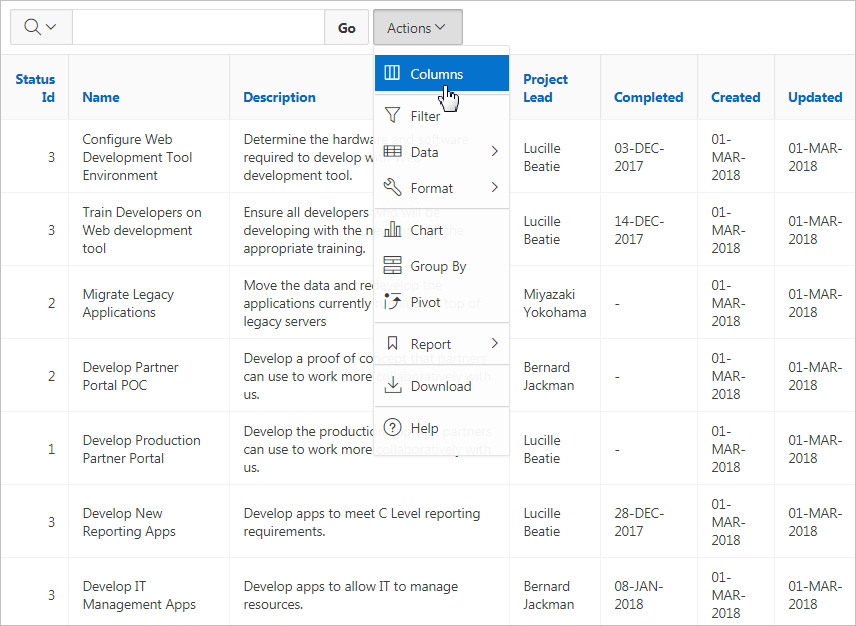
An interactive report is a formatted result of a SQL query. Both the Create Application Wizard and Create Page Wizard support the creation of interactive reports. You choose a table on which to build a report or provide a custom SQL SELECT statement. Interactive reports are only supported for Desktop applications. End users can customize the report layout and data displayed by selecting options on the Actions menu.
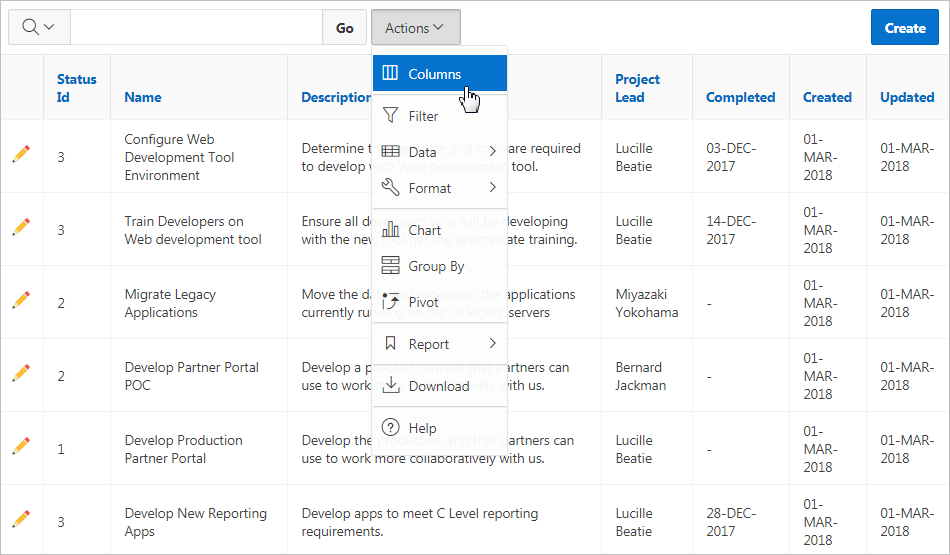
The following is an example of an interactive report.
Developers can include multiple interactive reports per page and can restrict the capabilities available to end users (such as disabling download or support for hiding column). When the end user views the report, report functionality is same across all reports in the application.
When viewing an interactive report, end users can customize how and what data displays. By default, interactive reports include a search bar, an Actions menu, column heading menus, and Edit icons in the first column of each row. Using options on the Actions menu, users can alter the report layout by hiding or exposing specific columns and applying filters, highlighting, and sorting. They can also define breaks, aggregations, charts, group bys, and add their own computations. Once customized, the report can be saved as either a private or public report.
See Also:
-
"Using Interactive Reports" in Oracle Application Express End User’s Guide
Parent topic: Understanding Report Types
Classic Report
A classic report is a formatted result of a SQL query. You choose a table on which to build a report, or provide a custom SQL SELECT statement or a PL/SQL function returning a SQL SELECT statement. With the exception of sorting and simple filtering, end users cannot customize a classic report. Both the Create Application Wizard and Create Page Wizard support the creation of classic reports.
The following is an example of a classic report.
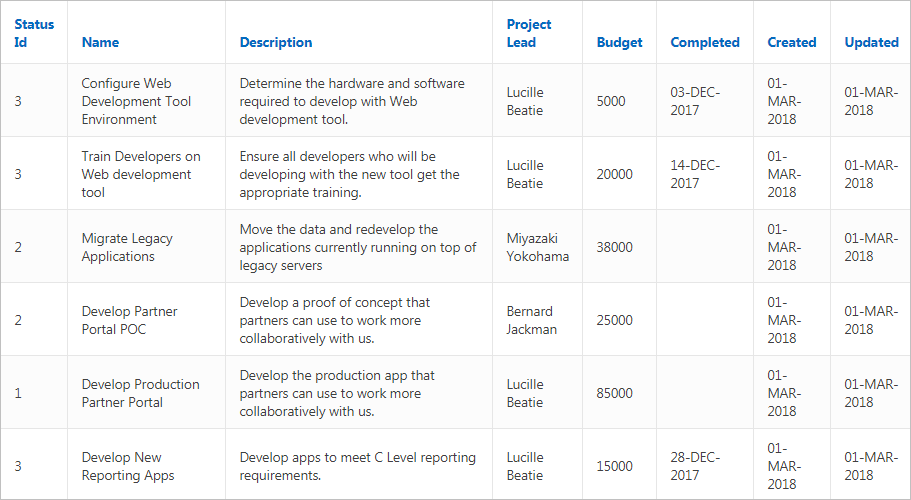
Description of the illustration rpt_classic.png
To create a classic report, developers either select a table or provide a SQL statement. Classic reports support general keyword search capability, the ability to specify the number of rows that display, and basic column sorting.
Tip:
Developers can create highly customized reports using report template (in particular, named column templates). See "Report Templates."
See Also:
Parent topic: Understanding Report Types
Report and Form
Developers can create a report and form on a table. Developers select a Report Type to determine if the report is an interactive grid, interactive report, or a classic report. Users click an Edit icon to access the form.
Both the Create Application Wizard and Create Page Wizard support the creation of a report and form combination. The main difference between the Create Application Wizard and Create Page Wizard is the amount of customization. with the Create Page Wizard the developer to select the report type (that is, interactive grid, interactive report, or classic) and the table. Additionally, the developer can also specify whether to include and configure breadcrumbs or a navigation menu and select the columns and the order in which they display.
The following is an example of an interactive grid report and form.
Description of the illustration report_form_ig.png
See Also:
Parent topic: Understanding Report Types
