11.4 Creating Charts

You can add a chart by running a built-in wizard or creating it manually in Page Designer.

11.4.1 About Supported Charts

App Builder supports two types of charts: Charts (based on the Oracle JavaScript Extension Toolkit (Oracle JET) Data Visualizations) and legacy AnyChart Charts.

App Builder supports the following charts:

  • Chart - Chart support in Oracle Application Express is based on the Oracle JET Data Visualizations. Oracle JET empowers developers by providing a modular open source toolkit based on modern JavaScript, CSS3, and HTML5 design and development principles. The Oracle JET data visualization components include customizable charts, gauges, and other components that you can use to present flat or hierarchical data in a graphical display for data analysis. Each Oracle JET visualization supports animation, accessibility, responsive layout, internationalization, test automation, and a range of inter activity features. The charts provide dozens of different ways to visualize a data set, including bar, line, area, range, combination, scatter, bubble, polar, radar, pie, donut, funnel, and stock charts..

See Also:

"Working with Data Visualizations" in JavaScript Extension Toolkit (JET) Developing Applications with Oracle JET.

  • AnyChart Chart - AnyChart chart support is based on a third party charting solution provided by AnyChart. This is a flexible Flash and JavaScript (HTML5) based solution that enables developers to create animated and compact interactive charts. AnyChart charts have been categorized as a legacy component and may be deprecated in a future release.

11.4.2 Sample Charts

Developers can view chart examples by installing the Sample Charts sample application.

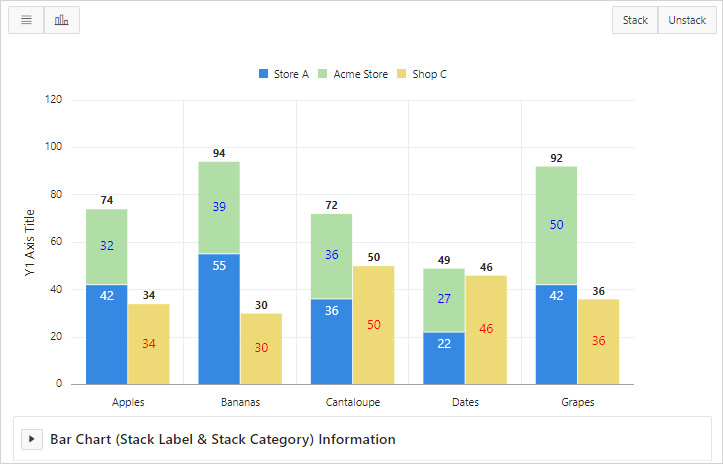
The following is a sample chart from page 9 of the Sample Charts sample application.
Description of sample_charts.png follows
Description of the illustration sample_charts.png

Click the Horizontal and Vertical to toggle between a horizontal or vertical display. Click Stack and Unstack to view two series of data or three series of data.

This chart displays two series of data, Store A and Acme Store, stacked and associated with the Y axis, and the third series of data, Shop C, associated with an extra Y axis and rendered as a separate chart below the other two series of data.

Expand the Bar Chart (Stack Label & Stack Category) Information region at the bottom of the page to view information on the chart.

See Also:

"Installing a Productivity and Sample App" for more information on installing the Sample Charts application

11.4.3 Adding a Chart on a New Page Using a Local Database

Add a chart on a new page using a local database:

To add a chart on a new page:

  1. On the Workspace home page, click the App Builder icon.
  2. Select an application.
  3. Click Create Page.
    The Create Page Wizard appears.
  4. For Create a Page:
    1. Page Type - Select Component and then Chart.

      Tip:

      Component pages provides page-level functionality and can be added multiple times within a given application such as reports, forms, charts, or calendars. Feature pages provide application-level functionality and can only be added once per application.

    2. Select select a chart type.

      Note:

      If you select Gantt, you are prompted to select a Gantt chart type.

  5. For Page and Region Attributes:
    1. Page Number - Enter a page in which the chart object is to appear.
    2. Page Name - Enter a page name.
    3. Page Mode - Select a page mode.
      • Normal - The page displays as a normal Application Express application page.

      • Modal Dialog - The page displays as a modal dialog. A modal dialog is an overlay window which remains active and focused until the end user closes it. The underlying page is grayed out which prevents the end user from interacting with the rest of the page until the dialog closes.

    4. Breadcrumb - Select whether you want to use a breadcrumb navigation control on your page.
    5. Click Next.
  6. For Navigation Preference, specify the type of navigation to include on this page and click Next. The navigation options (for example, navigation menu or tabs) depends upon the current application theme.

    Tip:

    The steps that follow assume you selected an Oracle JET chart. If you select a non-Oracle JET chart (for example, Gantt) the steps that follow may differ. Follow the on-screen instructions.

  7. The steps that follow depend upon the Source Type: Table or SQL Query.
    • If the Source Type is Table:

      1. Location - Select Local Database.

      2. Source Type - Select Table.

      3. Table/View Owner - Select the owner of the table on which you are building the chart.

      4. Table/View Name - Select the table or view on which the chart is based.

      5. Page Items to Submit - Enter a comma separated list of page items on the current page to be set into session state when the chart data gets read with a separate request.

      6. Maximum Rows - Enter the maximum number of rows you want to use to display the chart.

      7. Click Next.

    • If the Source Type is SQL Query:

      1. Location - Select Local Database.

      2. Source Type - Select SQL Query.

      3. SQL Query - Enter the SQL SELECT statement to be used for the chart. The SQL SELECT statement must include at least two columns.

      4. Page Items to Submit - Enter a comma separated list of page items on the current page to be set into session state when the chart data gets read with a separate request.

      5. Maximum Rows - Enter the maximum number of rows you want to use to display the chart.

      6. Click Next.

  8. For Column Mapping:
    1. Select the columns to be mapped to the chart. The options that display vary depending upon the chart type selected. To learn more about an attribute, click the field-level Help.
    2. Click Next.
  9. Click Create.

11.4.4 Adding a Chart on a New Page Using External Data Sources

Run the Create Page Wizard to add a new page with a chart using an external data source.

The component(s) described in this topic include built-in support for REST Enabled SQL and REST Data Sources which enables read and write access to remote data sources. In order to build a component on a remote data source, you must first create the application and configure the external data source.

Tip:

To learn more about external data sources, see "Managing REST Enabled SQL References" and "Managing REST Data Sources."

To add a chart on a new page using an external data source:

  1. Run the Create Page Wizard:
    1. Navigate to the Workspace home page.
    2. Click the App Builder icon.
    3. Select an application.
    4. On the Application home page, click Create Page.
      The Create Page Wizard appears.
  2. On Create a Page:
    1. Page Type - Select Component.
    2. Click Chart.
  3. For Chart Type, select a chart type.

    Note:

    If you select Gantt, you are prompted to select a Gantt chart type.

  4. For Page and Region Attributes:
    1. Page Number - Enter a page in which the chart object is to appear.
    2. Page Name - Enter a page name.
    3. Page Mode - Select a page mode. Normal presents the page as a normal Application Express application page. Modal Dialog presents the page as an overlay window positioned which remains active and focused until the end user dismisses (closes) it. The underlying page is grayed out and the end user is prevented from interacting with the rest of the page until the dialog is closed.
    4. Breadcrumb - Select whether you want to use a breadcrumb navigation control on your page.
    5. Click Next.
  5. For Navigation Preference, specify the type of navigation to include on this page and click Next. The navigation options (for example, navigation menu or tabs) depends upon the current application theme.

    Tip:

    The steps that follow assume you selected an Oracle JET chart. If you select a non-Oracle JET chart (for example, Gantt) the steps that follow may differ. Follow the on-screen instructions.

  6. For Source, select a remote data source:
    • REST Enabled SQL Service - Data is sourced from a remote database, where the connection is defined using REST Enabled SQL. To create or maintain REST Enabled SQL references, navigate to Shared Components, REST Enabled SQL.

    • REST Data Source - Data is sourced from a RESTful web service defined using REST Data Sources. REST Data Source are created and maintained within Shared Components.

  7. The steps that follow depend upon the Source Type: Table or SQL Query.
    • If the Source Type is Table:

      1. Source Type - Select Table.

      2. Table/View Owner - Select the owner of the table on which you are building the chart.

      3. Table/View Name - Select the table or view on which the chart is based.

      4. Page Items to Submit - Enter a comma separated list of page items on the current page to be set into session state when the chart data gets read with a separate request.

      5. Maximum Rows - Enter the maximum number of rows you want to use to display the chart.

      6. Click Next.

    • If the Source Type is SQL Query:

      1. Source Type - Select SQL Query.

      2. SQL Query - Enter the SQL SELECT statement to be used for the chart. The SQL SELECT statement must include at least two columns.

      3. Page Items to Submit - Enter a comma separated list of page items on the current page to be set into session state when the chart data gets read with a separate request.

      4. Maximum Rows - Enter the maximum number of rows you want to use to display the chart.

      5. Click Next.

  8. For Column Mapping:
    1. Select the columns to be mapped to the chart. The options that display vary depending upon the chart type selected. To learn more about an attribute, click the field-level Help.
    2. Click Next.
  9. Click Create.

11.4.5 Adding a Chart in Page Designer

Add a chart by creating it manually in Page Designer.

To add a chart to an existing page in Page Designer:

  1. View the page to contain the chart in Page Designer.
  2. In the Gallery at the bottom of the central pane, click Regions and locate Chart.
    The Gallery lists all controls or components you can add to a page. Passing the cursor over a control or component displays a tooltip that describes it.
  3. From the Gallery,
    1. Right-click Chart to view the context menu.
    2. Select Add To and then the desired location.

    Tip:

    You can also click Chart in the Gallery and drag it to the appropriate location in the Layout tab.

  4. Page Designer indicates what to do next. If there is an error, the Show Messages icon displays in the Page Developer toolbar.
    1. Click the Show Messages icon on the Page Designer toolbar.
      The Messages dialog displays errors that must be addressed.
    2. Select an error to highlight the associated attribute in the Property Editor.
  5. Edit the Series:
    1. In the Rendering tab under the chart, expand the Series node and select the new series.
    2. Under Series node, select a series.
    3. Source, Location - Select the location of the database you want to use. Options include:
      • Local Database - Data is sourced from a local database. (This location is selected by default.)

      • REST Enabled SQL - Data is sourced from a remote database, where the connection is defined using REST Enabled SQL Reference.

      • REST Source - Data is sourced from a RESTful web service defined using REST Data Sources.

    4. Column Mapping, Label - Select the column name to be used for defining the label(s) of the x-axis on the chart. For a Stock chart, the column should be of data type Date/Timestamp, to represent the stock information on a time axis
    5. Column Mapping, Value - Select the column name to be used for defining the value on this chart. For a Box Plot chart, this column will be used for defining the minimum, quartiles, median, and maximum values of the numerical data set.

    Note:

    To view help for an attribute, select the attribute in the Property Editor and click the Help tab in the central pane.

  6. Expand the Axes node:

    Tip:

    The Axes node only displays for chart types that support axes (such as area, bar, bubble, combination, line, line with area, polar, radar, range, scatter, and stock).

    1. In the Rendering tab under the chart, expand the Axes node.
    2. Under Axes node, select an Axis.
    3. Edit the required axis attributes and define any data formatting to be applied to the axis values.
  7. Edit the Region attributes.
    1. In the left pane (or Rendering tab), select the chart.
      The Property Editor, Region tab displays the region attributes
    2. Review and edit the region attributes in the Property Editor.
  8. Edit the chart Attributes:
    1. In the Property Editor, select the Attributes tab.
    2. Edit the required chart attributes.
  9. Click Save or Save and Run Page.

11.4.6 Editing Charts

You can alter how a chart displays by editing chart attributes in Page Designer.

11.4.6.1 Editing Chart Attributes

Charts have three types of attributes: Region attributes, chart Attributes, and Series attributes. When you select a chart in the Rendering tab, the Property Editor displays two tabs: Region (which contains Region attributes) and Attributes (which contains chart Attributes). Series attributes display in the Rendering tab under the chart.

To edit chart attributes:

  1. View the page containing the calendar in Page Designer:
    1. On the Workspace home page, click the App Builder icon.
    2. Select an application.
    3. Select a page.

    Page Designer appears.

    The Property Editor in the right pane displays displays two tabs: Region and Attributes. Attributes are organized in groups. To view help for an attribute, select the attribute in the Property Editor and click the Help tab in the central pane.

  2. To edit the Region attributes.
    1. In the left pane (or Rendering tab), select the chart.
      The Property Editor, Region tab displays the region attributes
    2. Review and edit the region attributes in the Property Editor.
  3. To edit the chart Attributes.
    1. In the left pane (or Rendering tab), select the chart.
    2. In the Property Editor, select the Attributes tab.
    3. Review and edit the chart Attributes in the Property Editor.
  4. To edit the Series:
    1. In the Rendering tab under the chart, select the Series.
    2. Review and edit the Series attributes in the Property Editor.
  5. Click Save.

11.4.6.2 Switching Chart Type

Once you create a chart, you can switch its chart type by editing chart attributes.

To switch a chart type:

  1. View the page containing the chart in Page Designer.
  2. In the left pane (or Rendering tab), select the chart.
    The Property Editor (right pane) displays two tabs.
  3. Edit the chart Attributes and select a new chart type:
    1. In the Property Editor, select the Attributes tab.
      The Property Editor displays chart Attributes. Attributes are organized in groups. To view help for an attribute, select the attribute in the Property Editor and click the Help tab in the central pane.
    2. Chart, Type - Select the chart type you want to switch to. For example, Combination.
  4. Edit the Series:
    1. In the Rendering tab under the chart, select the Series.
      The Series tab appears in the Property Editor.
    2. Column Mapping - Ensure all required Column Mapping columns have been defined.

      Note:

      Column mappings may differ for different chart types, so you must ensure all required column mappings are defined for the selected chart type.

    3. Type - Select the chart series type. For example, Bar Range.
      Only certain chart types support combining different types of series on the same data plot. The Series Type attribute only displays for chart types Combination, Polar, Radar, and Range.
  5. Click Save or Save and Run Page.

11.4.6.3 Enabling Automatic Refresh

Charts can monitor information by enabling the Automatic Refresh, Interval attribute, or by using a dynamic action with the Refresh action.

11.4.6.3.1 Enabling the Automatic Refresh Attribute
Enabling the Automatic Refresh attribute updates the chart to reflect changes in the underlying data within a specified time interval.

To enable automatic refresh updates:

  1. View the page containing the chart in Page Designer.
  2. In the left pane (or Rendering tab), select the chart.
  3. In the Property Editor, select the Attributes tab.
  4. Find Automatic Refresh.
  5. In Automatic Refresh, Interval - Enter the interval in seconds between chart updates.
    Very small updates intervals, such as 2 seconds, are discouraged since they may cause serious database performance issues.
  6. Click Save.
11.4.6.3.2 Creating a Refresh Dynamic Action

To create a Refresh dynamic action:

  1. View the page containing the chart in Page Designer.
  2. Click the Dynamic Actions tab in the left pane.
  3. Under Dynamic Actions, right-click Events and select Create Dynamic Action.
  4. Page Designer indicates what to do next. If there is an error, the Show Messages icon displays in the Page Developer toolbar.
    1. Click the Show Messages icon on the Page Designer toolbar.
      The Messages dialog displays errors that must be addressed.
    2. Select an error to highlight the associated attribute in the Property Editor.
  5. In the Property Editor, edit the following Dynamic Action attributes:
    1. Identification, Name - Enter a name of the dynamic action.
    2. Execution Options, Sequence - Specify the sequence for this component. The sequence determines the order of evaluation.
    3. When, Event - Specify the event that causes the dynamic action to fire.
    4. When, Selection Type - Select the type of page element or construct to be used to trigger the event. For examples, select the attribute in the Property Editor and click the Help tab in the center pane.

    Tip:

    To learn more about an attribute, select the attribute in the Property Editor and click the Help tab in the center pane.

  6. In the Rendering tab, select the first action under True:
    1. Identification, Action - Select Refresh.
    2. Affected Elements, Selection Type - Select Region.
    3. Affected Elements, Region - Select the region containing the chart.
  7. Click Save.

11.4.6.4 Using Custom JavaScript with Charts

Control the look and feel of a chart by adding custom JavaScript.

Tip:

The Sample Charts application contains a number of examples of using custom JavaScript with chart. See "Installing a Productivity and Sample App" for more information on installing sample applications.

To use custom JavaScript:

  1. View the page in Page Designer:
    Page Designer appears.
  2. In the left pane (or Rendering tab), select the chart.
  3. In the Property Editor, select the Attributes tab.
  4. Find Advanced.
  5. In Advanced, JavaScript Initialization Code, enter the code to customise your chart.

    For example:

    function( options ){
        // Setup a callback function which gets called 
       // when data is retrieved, it allows to manipulate the series
        options.dataFilter = function( data ) {
    
            // e.g Set the first series of chart to the colour red
            data.series[ 0 ].color = "red";
        };
        // Set chart initialization options
        // e.g. Set chart type to Line
        options.type = "line";
        return options;
    }
  6. Click Save.

    Tip:

    For more information on supported chart options, see "ojChart" in JSDoc pages for the Oracle JavaScript Extension Toolkit (JET).