10.4.6 Editing Maps

Edit map region components in Page Designer.

10.4.6.1 Viewing and Editing a Map in Page Designer

View and edit the components that comprise a map by viewing attributes in Page Designer.

A map features a map region which contains spatial geometry layers. This topic explores an earthquake map built on a local table named EARTHQUAKE_TABLE which features a Heat Map spatial geometry layer.
To view or edit a map in Page Designer:
  1. View the page in Page Designer:
    1. On the Workspace home page, click the App Builder icon.
    2. Select an application.
    3. Select a page.
    Page Designer appears displaying Page attributes in the Property Editor (right pane).
  2. Review the map region.
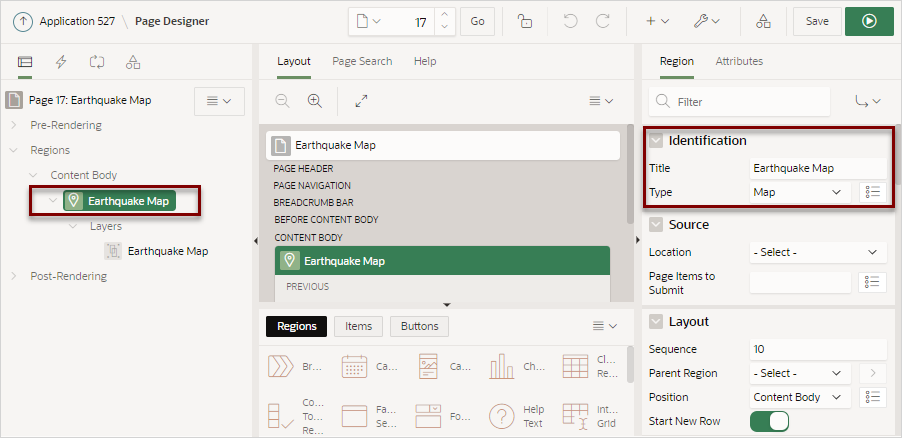
    1. In the Rendering tab select the Map region. The Property Editor (right pane) displays two tabs: Region and Attributes.
      Description of map_region_attributes.png follows
      Description of the illustration map_region_attributes.png

      In the previous example, note that Identification, Title indicates the map is named Earthquake Map and the Type is Map.

    2. In the Property Editor, click the Attributes tab.
      Description of map_attributes.png follows
      Description of the illustration map_attributes.png

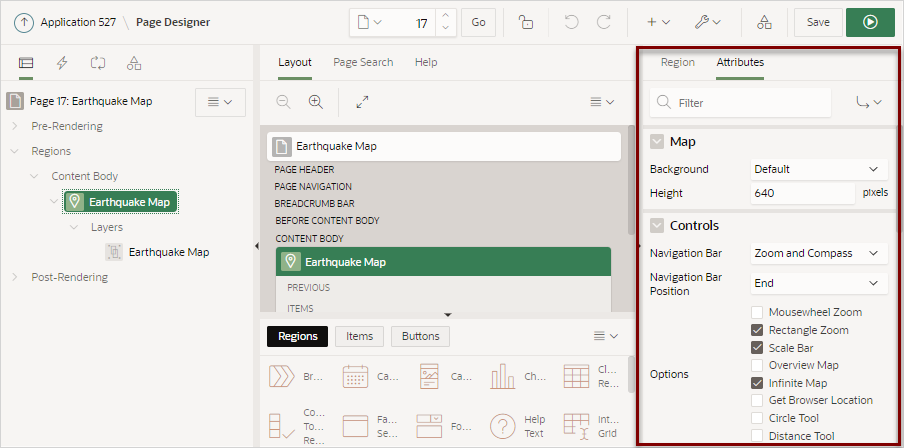
      Map Attributes determine basic map characteristics. In the previous example, note the attributes under Controls. Controls determine the various ways users can change the map display at runtime, for example:

      • Navigation Bar - Options include None, Zoom Only and Zoom and Compass.

      • Navigation Bar Position - Start positions the navigation bar on the starting position (typically to the left side) of the map. End positions the navigation bar on the ending position (typically to the right side) of the map.

      • Mousewheel Zoom - Zoom in or out by using the mouse wheel.

      • Rectangle Zoom - Zoom the map to an area by drawing a rectangle onto the map.

      • Scale Bar - Display a scale bar on the map.

      • Overview Map - Display an overview map in the lower right.

      • Infinite Map - Enables infinite map scrolling.

      • Get Browser - Displays the user's current location from their browser.

      • Circle Tool - Enables end users to draw a circle onto the map. When finished, an event is triggered, so that the circle can be processed by Dynamic Actions or JavaScript code.

      • Distance Tool - Enables end users to measure distances between points on the map.

      Note that in the previous example only some of these controls are enabled.

  3. Review the map Layers. Maps have spatial geometry objects (or layers) which are drawn on the map based on data in a table.
    1. In the Rendering tab, select the Layer, Earthquake Map.

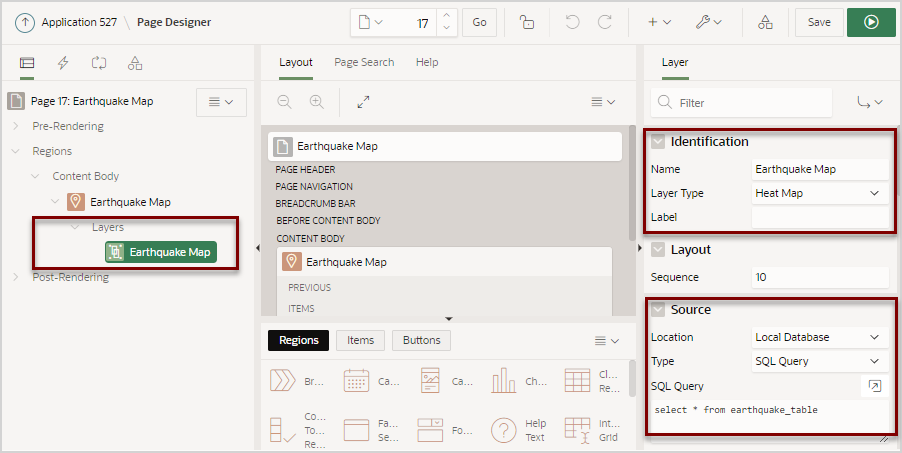
      Note that the following example has a Heat Map layer which is sourced from a local database using a SQL Query.

      Description of map_layer_att_source.png follows
      Description of the illustration map_layer_att_source.png
  4. Review the Column Mappings. In the Property Editor, scroll down to Column Mappings.
    Description of map_layer_att_columns.png follows
    Description of the illustration map_layer_att_columns.png

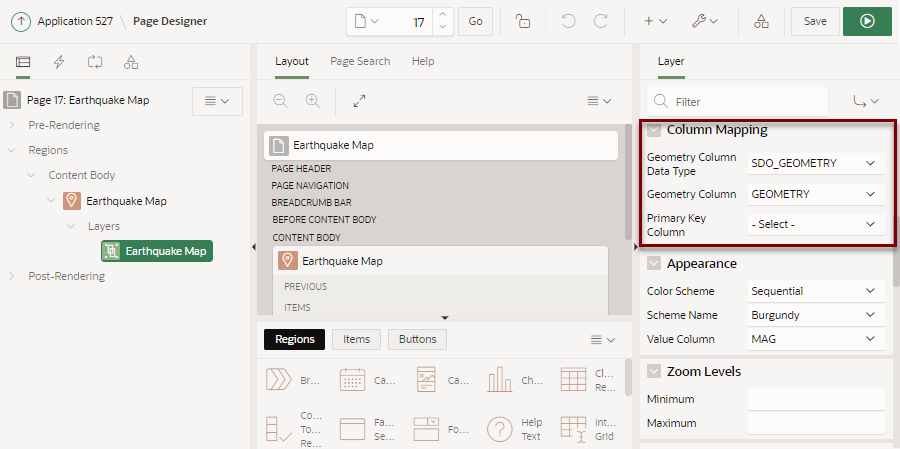
    In the previous example, note that the Column Mapping attributes indicate the Geometry Column Data Type is SDO_GEOMETRY and the Geometry Column is GEOMETRY.

10.4.6.2 Adding a New Layer to an Existing Map

Edit the map region defintion to add more spatial geometry objects.

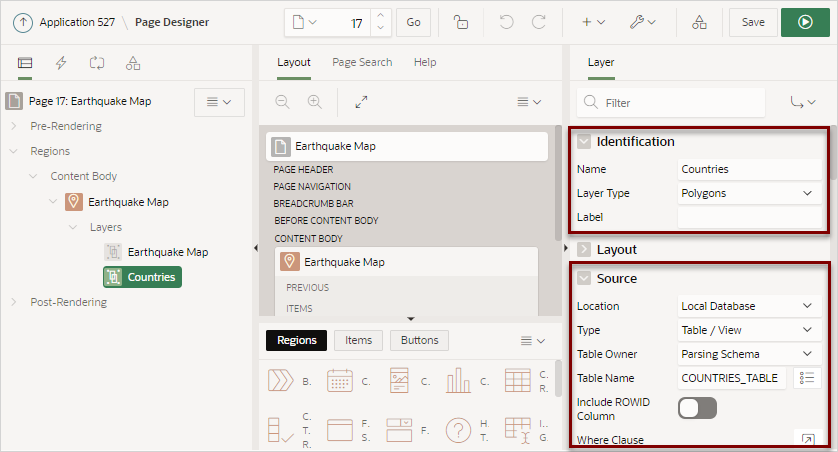
Maps have spatial geometry objects which are drawn on the map based on data in a table. This topic demonstates how to add a polygon object layer to an existing map that identifies the county. This topic includes an example which adds an object layer named Countries sourced from a local table named COUNTRIES_TABLE and mapped to the GEOMETRY column.
To add a new object layer to an existing map:
  1. View the page in Page Designer:
    1. On the Workspace home page, click the App Builder icon.
    2. Select an application.
    3. Select a page.
    Page Designer appears displaying Page attributes in the Property Editor (right pane).
  2. Add a spatial geometry layer. In the Rendering tab, right-click Layers and select Create Layer.
  3. Page Designer indicates what to do next. If there is an error, the Show Messages icon displays in the Page Developer toolbar.
    1. Click the Show Messages icon on the Page Designer toolbar.
      The Messages dialog displays errors that must be addressed.
    2. Select an error to highlight the associated attribute in the Property Editor.
  4. Edit the Identification attributes:
    1. Identification, Name - Enter a descriptive name (for example, Countries).
    2. Identification, Layer Type - Select spatial geometry type (for example, Polygons).
  5. Edit the Source attributes.
    1. Source, Location - Determines the location of the date (for example, Local Database.
    2. Source, Type - Select how the data is queried (for example, Table / View.
    3. Source, Table Name - Select the table (for example, COUNTRIES_TABLE).
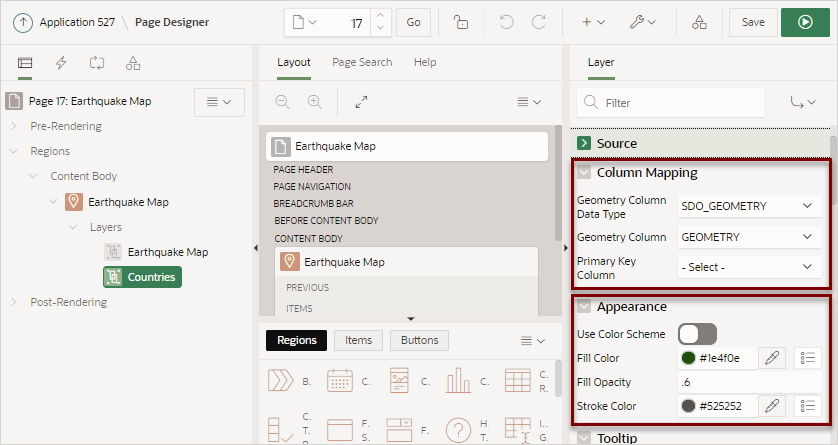
  6. Edit the Column Mapping attributes:
    1. Column Mapping, Geometry Column Data Type - Select the data type of the geometry column (for example, SDO_GEOMETRY).
    2. Column Mapping, Geometry Column - Select the data type of the geometry column (for example, GEOMETRY).
  7. Edit the Appearance attributes:
    1. Appearance, Fill Color - Specify the fill color.
    2. Appearance, Fill Opacity - Specify fill opacity. Ranges from zero (fully transparent) to 1.0 (opaque).
    3. Appearance, Stroke Color - Specify the stroke color.
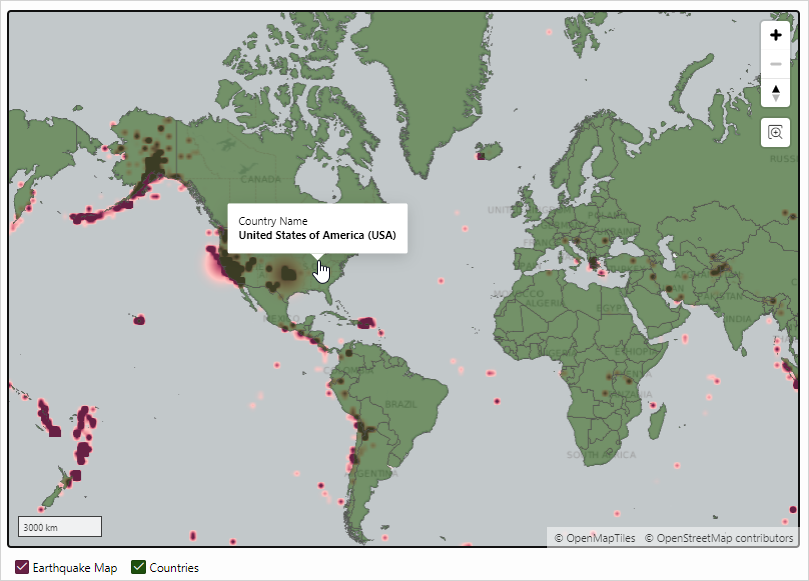
  8. Configure the Tool Tip. The Tooltip displays when the user's mouse hovers over a polygon. The following example uses an HTML expression with column substitutions. However, you can also use the Template Directives, as with the Cards Region type.
    1. Tooltip, Advanced Formatting - Specify whether the tooltip displays using a column or advanced formatting using HTML expressions and supported substitution strings. This example enables Advanced Formatting.
    2. Appearance, HTML Expression - Enter HTML expressions to be shown as tooltip when hovering over an object on the map. Use &COLUMN. syntax to show column values in HTML. For example:
      Country Name<br>
      <b>&COUNTRY_NAME. (&ISO_A2.)</b>

    Tip:

    For more information on the supported Template Directives, see applyTemplate in Oracle Application Express JavaScript API Reference.
  9. Legend, Enable to Hide - Determines whether layer visibility can be toggled by clicking layer name in the legend. Prevent the legend from hiding the country polygons. Disable Enable to Hide.
  10. Click Save.
  11. Click Save and Run Page.

    The map appears showing two layers: Earthquake Heat Map and Countries.

    Description of sample_map_two_layers.png follows
    Description of the illustration sample_map_two_layers.png

10.4.6.3 Controlling Layer Visibility

Control layer visibility by editing attributes in Page Designer.

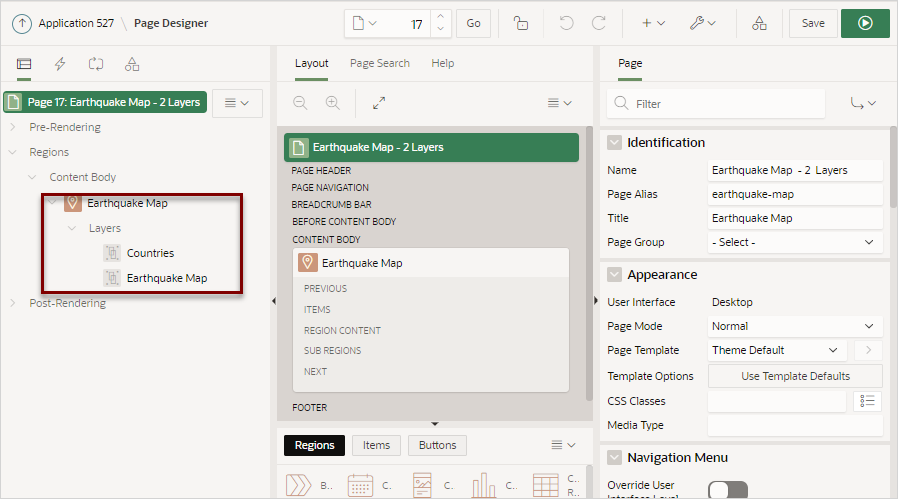
This topic assumes you have a map that has two spatial geometry objects layers: Countries and Earthquake Map. The Countries layer is based on a local table named COUNTRIES_TABLE. Earthquake Map is sourced from a local table named EARTHQUAKE_TABLE and features a Heat Map spatial geometry layer.
This task demonstrates how to attributes in Page Designer and control the visibility of the Earthquake Map object layer. In this topic you specify zoom levels and add a server-side condition that specifies that only earthquakes with a magnitude of greater than two display.
To control layer visibility:
  1. View the map page in Page Designer:

    Page Designer appears. In the following example, the map has two spatial geometry objects layers: Countries and Earthquake Map.

    Description of quake_map_2_layers.png follows
    Description of the illustration quake_map_2_layers.png
  2. In the Rendering tab (left pane), under Layers, select Earthquake Map.
    Layer attributes display in the Property Editor.
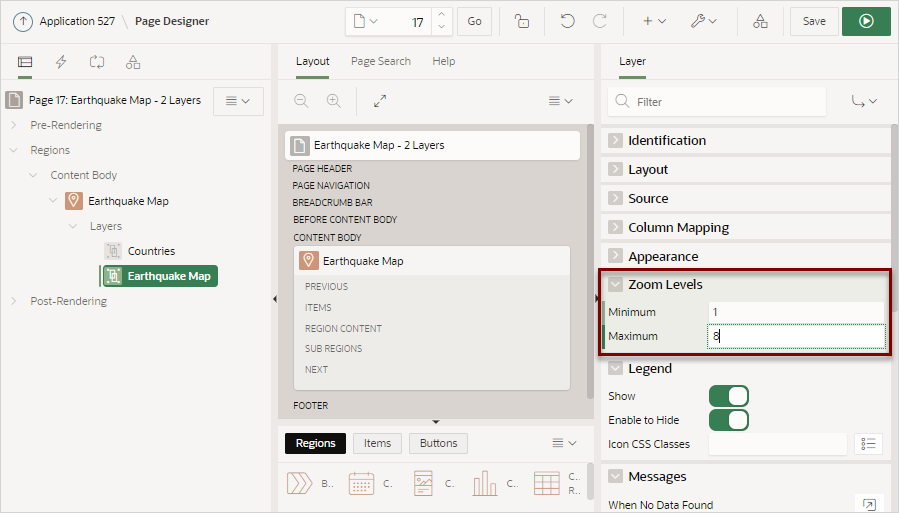
  3. In the Property Editor, edit Zoom Levels attributes:

    Zoom Levels must have a Minimum value of 1 and a Maximum value of 18.

    1. Zoom Levels, Minimum - Specify the Minimum zoom level for this layer to become visible ( for example, enter 1).
    2. Zoom Levels, Maximum - Specify the Maximum zoom level for this layer to become visible (for example, enter 8).
      Description of quake_map_zoom.png follows
      Description of the illustration quake_map_zoom.png

      These settings decrease the available zoom levels from the default (1 to 18) to 1 to 8. When the user zooms outside of specified Zoom Levels, the layer disappears.

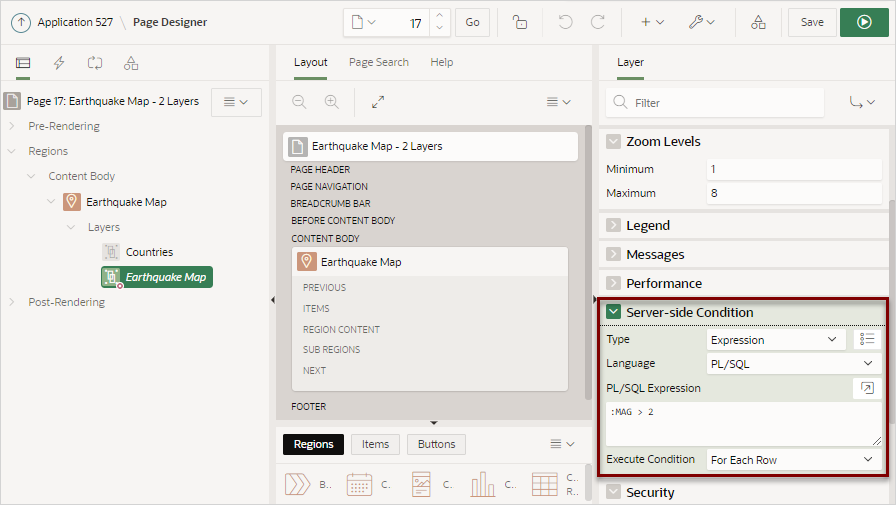
  4. Create a server-side condition:
    1. Server-side Condition, Type - Select Expression.
    2. Server-side Condition, PL/SQL Expression - Enter :MAG > 2
    3. Server-side Condition, Execute Condition - Select For Each Row.
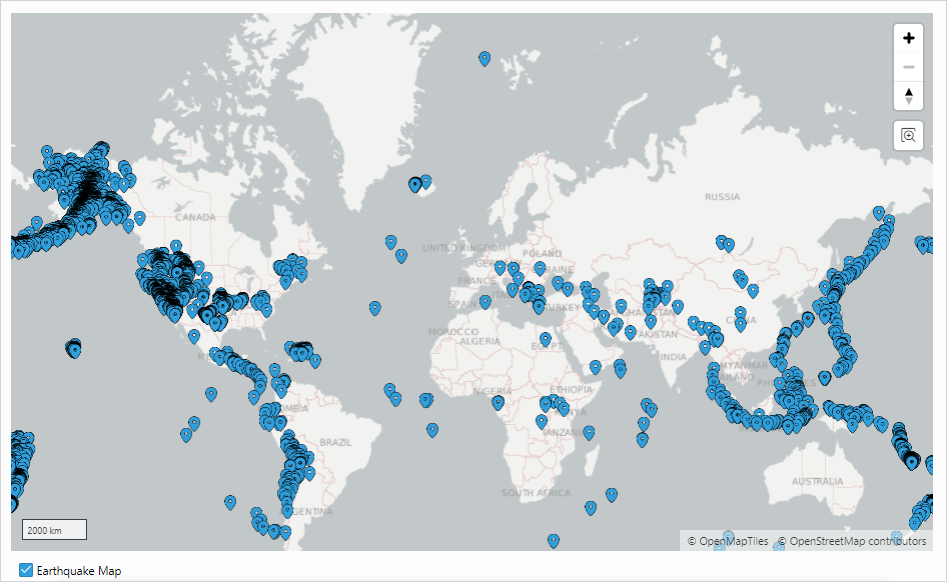
  5. Click Save and Run Page to view the application runtime. and only eight zoom levels are available.
    The map appears. Only eight zoom levels are available and only earthquakes with a magnitude greater than 2 display.

10.4.6.4 Connecting a Map Region with a Report Region

Connect a map region with a classic report region.

This topic explains how to connect a map region with a classic reort so that whenever the map region changes (that is, moves or zooms in or out), the report region refreshes to reflect the change. In order to connect a map region with a report region, this example creates a page which includes the following:

  • A map containing an object layer named Earthquake Map sourced from a local table named EARTHQUAKE_TABLE.

  • A classic report based on a SQL query also based on EARTHQUAKE_TABLE.

  • To sync the map with the report, a hidden page item used to maintain the current map status (also known as a bounding box). A bounding box (usually shortened to bbox) is an area defined by two longitudes and two latitudes.

  • A dynamic action to refresh the report as the map display changes.

Note:

Because of a restrictions within Oracle Spatial, this example only works if the map shows less than half of the earth. Therefore, the report will not refresh for zoom levels 1 and 2 of the map. See "Coordinate Systems (Spatial Reference Systems)" in Oracle Spatial Developer's Guide.

To connect map with a report region:

  1. Run the Create Application Wizard and create an application.
  2. Run the Create Page Wizard and create a new map page:
    1. On the Application home page, click Create Page.
    2. Create a Page - Select Map.
    3. Page Attributes - Enter a Page Name (for example, Earthquake Map) and click Next.
    4. For Navigation Preference - Select how you want this page integrated into the Navigation Menu and click Next.
    5. On Report Source:
      • Data Source - Select a Data Source for the page (for example, Local Database).

      • Source Type - Specify the source of the new page (for example, Table).

      • Table - Select a table on which to build the map (for example, EARTHQUAKE_TABLE).

      • Click Next.

    6. On Create Page:
      • Select the spatial geometry layer type (for example, Points).

      • Geometry Column Type - Select how spatial objects are sourced. (for example, Geometry Column).

      • Geometry Column - Pick the spatial geometry column (for example, GEOMETRY).

      • Tooltip Column - Select the column to be used as tooltip (for example, MAG).

      • Click Create.

    7. If you run the page, the earthquake map appears.
    8. Return to Page Designer. Click Edit Page X on the Runtime Developer toolbar, where X is the page number.
    Page Designer appears.
  3. Add a classic report adjacent to the map:
    1. In the Rendering tab, select Earthquake Map region.
    2. In the Gallery at the bottom of the central pane, locate Classic Report.
    3. Right-click Classic Report and select Add To, Content Body, Earthquake Map, and then Column After.
      A New Classic Report region appears next to the Earthquake Map in the Layout tab.
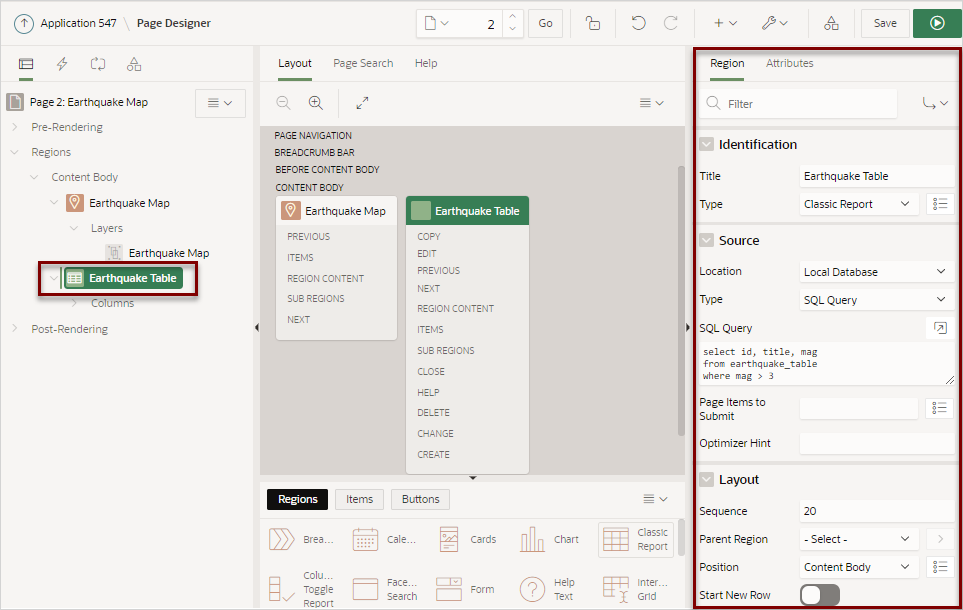
    4. In the Property Editor, edit the following Region attributes:
      • Identification, Title - Enter Earthquake Table

      • Source, Type - Select SQL Query.

      • Source, SQL Query - Enter:

        select id, title, mag
        from earthquake_table
        where mag > 3
      • Layout, Sequence - Enter 20

      Description of quake_rpt_region_att.png follows
      Description of the illustration quake_rpt_region_att.png
    5. Edit the Classic Report region Attributes:
      • Click the Attributes tab.

      • Messages, When No Data Found - Enter:

        No features on the map. If you're zoomed out to the whole earth, zoom in to see data.

    6. Click Save and Run Page.

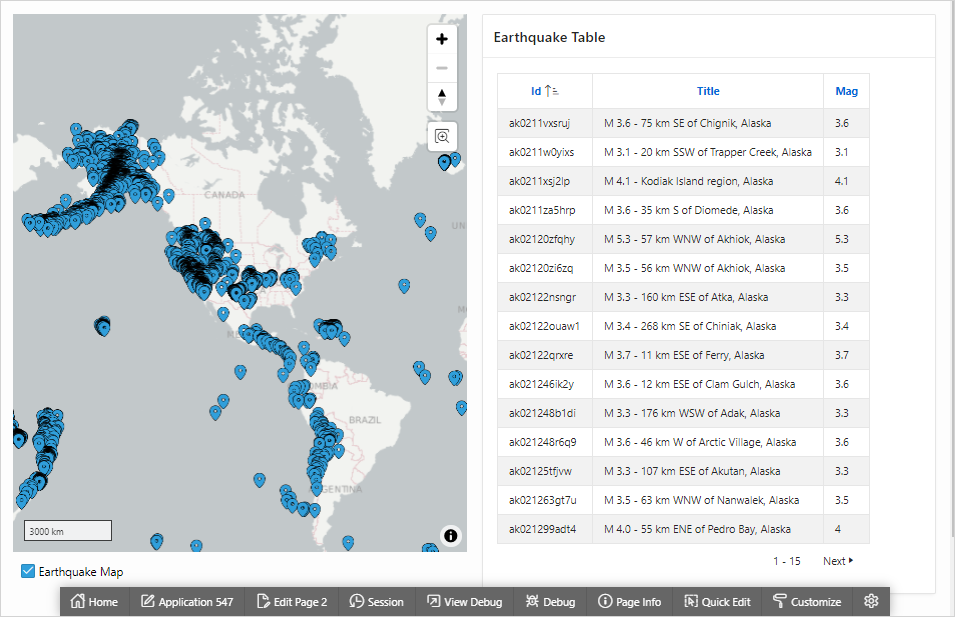
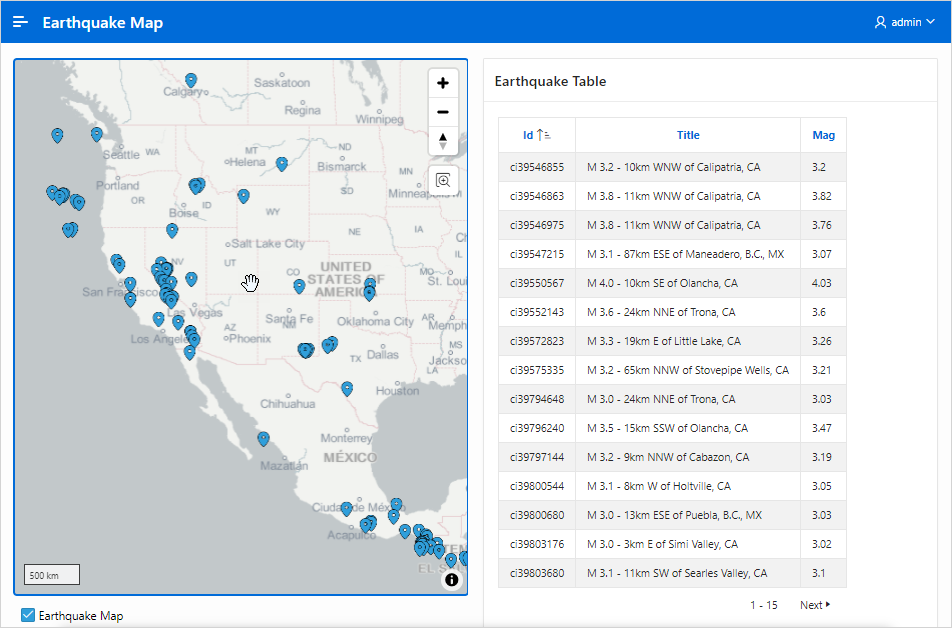
      The new classic report displays to the right of the earthquake map.

      Description of quake_map_rpt.png follows
      Description of the illustration quake_map_rpt.png
    7. Return to Page Designer. Click Edit Page X on the Runtime Developer toolbar, where X is the page number.
  4. Add a hidden page item to maintain the current map status (also known as a bounding box).
    1. In the Rendering tab, right-click Earthquake Table and select Create Page Item.
    2. Edit the following Page Item attributes in the Property Editor:
      • Identification, Name - Enter PX_BBOX , where X is the page number.

      • Identification, Type - Select Hidden.

      • Settings, Value Protected - Disable this option.

  5. Update the Earthquake Map region:
    1. In the Rendering tab, select the Earthquake Map region.
    2. In the Property Editor, click Attributes.
    3. Advanced, Bounding Box Item - Select PX_BBOX , where X is the page number.
    4. Click Save.
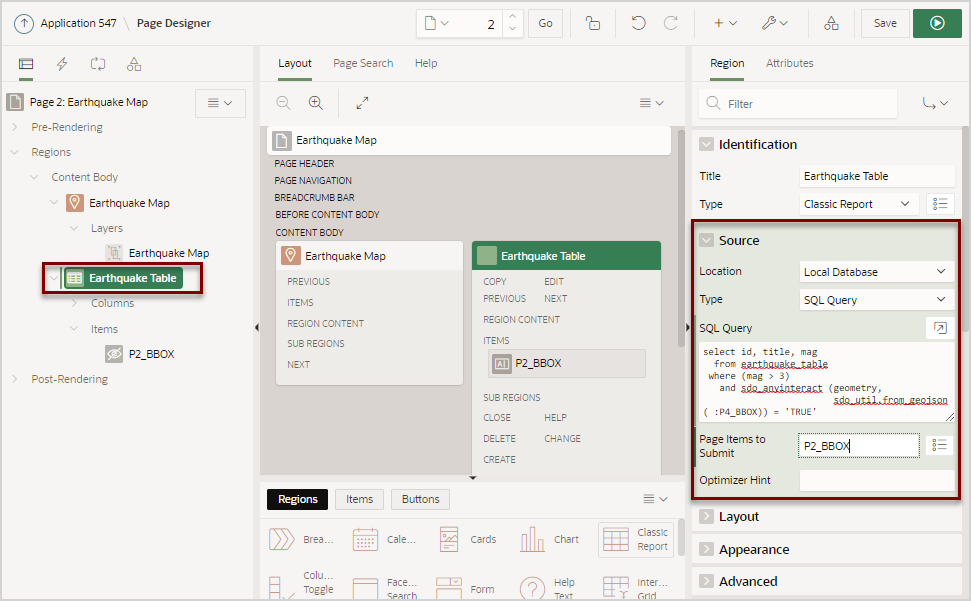
  6. Update the SQL query that defines the classic report to include the spatial filter:
    1. In the Rendering tab, select the Earthquake Table region.
    2. In the Property Editor, update the following:
      • Source, SQL Query - Enter:

        select id, title, mag
          from earthquake_table
         where (mag > 3)
           and sdo_anyinteract (geometry,
                                sdo_util.from_geojson ( :PX_BBOX)) = 'TRUE'
      • Source, Page Items to Submit - Select PX_BBOX , where X is the page number.

      Description of update_quake_rpt_source.png follows
      Description of the illustration update_quake_rpt_source.png
  7. Add a dynamic action to refresh the report as the map display changes:
    1. In the Rendering tab, right-click the map region, Earthquake Map and select Create Dynamic Action.
    2. In the Property Editor, edit the following Dynamic Action attributes:
      • Identification, Name - Enter a name for this dynamic action (for example, Map Change).

      • When, Event - Select Map Changed [Map].

      • Client-side Condition, Type - Select Item is not null.

      • Client-side Condition, Items - Select PX_BBOX , where X is the page number.

      Next, add TRUE actions.

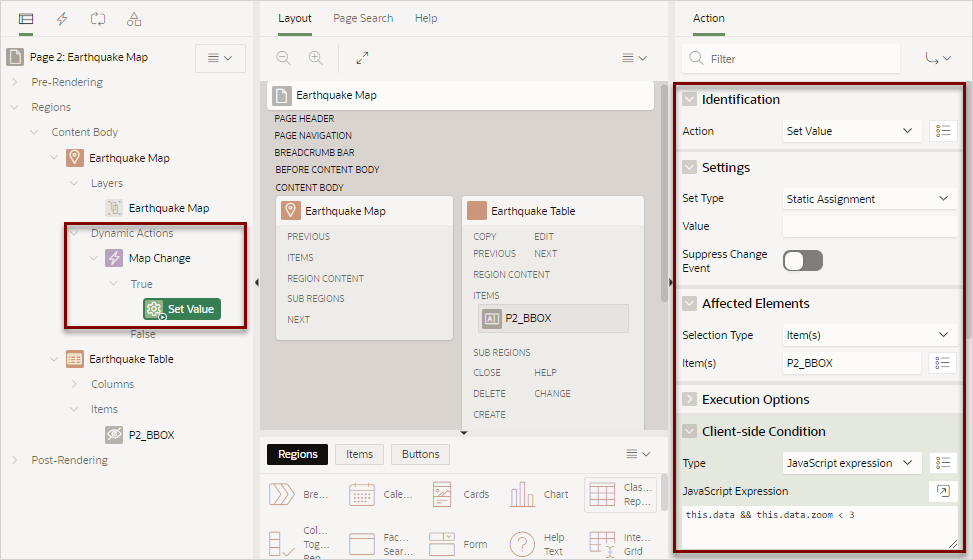
  8. Add a Set Value Action which resets the PX_BBOX item (which is set by the map region) to NULL, if the current zoom level is below 3.
    1. In the Rendering tab, select the existing True action, Show.
    2. Edit the following attributes in the Property Editor:
      • Identification, Action - Select Set Value.

      • Settings, Set Type - Select Static Assignment.

      • Affected Elements, Item(s) - Select PX_BBOX , where X is the page number.

      • Client-side Condition, Type - Select JavaScript expression.

      • Client-side Condition, JavaScript expression - Enter:

        this.data && this.data.zoom < 3

      Description of set_value_action.png follows
      Description of the illustration set_value_action.png
  9. Add a Show Action to show the report region if PX_BBOX is not NULL. This action in combination with the Set Value action will hide the report for zoom levels 0, 1 and 2.
    1. In the Rendering tab, select the Map Change dynamic action and select Create TRUE Action.
    2. Edit the following attributes in the Property Editor:
      • Identification, Action - Select Show.

      • Affected Elements, Selection Type - Select Region.

      • Affected Elements, Region - Select Earthquake Table.

      • Client-side Condition, Type - Select Item is not null.

      • Client-side Condition, Item - Select PX_BBOX , where X is the page number.

  10. Add Hide Action to hide the classic report if PX_BBOX is NULL.
    1. In the Rendering tab, select the Map Change dynamic action and select Create TRUE Action.
    2. Edit the following attributes in the Property Editor:
      • Identification, Action - Select Hide.

      • Affected Elements, Selection Type - Select Region.

      • Affected Elements, Region - Select Earthquake Table.

      • Client-side Condition, Type - Select Item is null.

      • Client-side Condition, Item - Select PX_BBOX , where X is the page number.

      • Click Save.

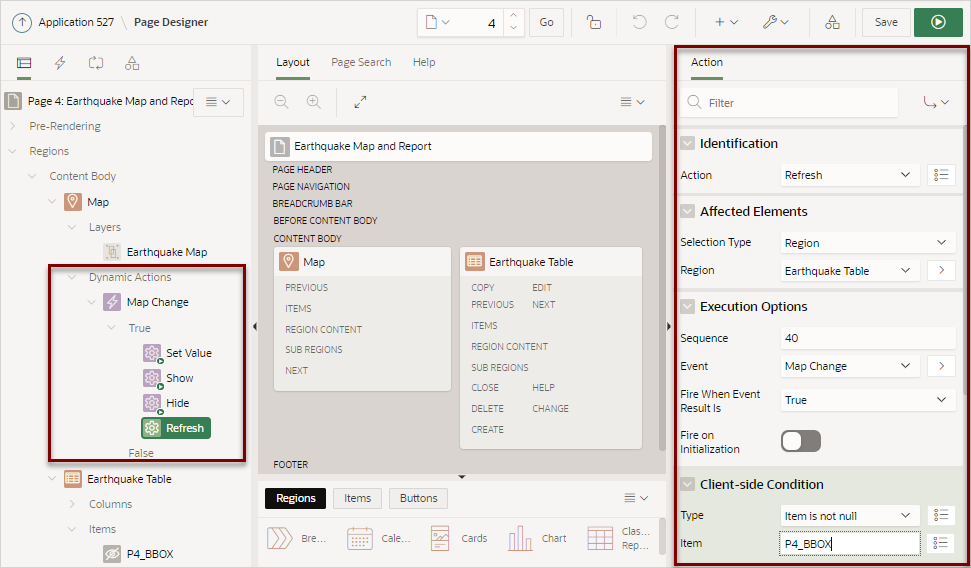
  11. Add Refresh Action to refresh the classic report if it is visible (that is if PX_BBOX is not NULL).
    1. In the Rendering tab, select the Map Change dynamic action and select Create TRUE Action.
    2. Edit the following attributes in the Property Editor:
      • Identification, Action - Select Refresh.

      • Affected Elements, Selection Type - Select Region.

      • Affected Elements, Region - Select Earthquake Table.

      • Client-side Condition, Type - Select Item is not null.

      • Client-side Condition, Item - Select PX_BBOX , where X is the page number.

      • Click Save.

      Description of refresh_action.png follows
      Description of the illustration refresh_action.png
  12. Click Save and Run Page.

    Initially, the report does not appear.

  13. In the navigation bar, click Zoom twice.

    The Earthquake Table appears.

    Description of quake_map_final.png follows
    Description of the illustration quake_map_final.png

    If you reposition the map, Earthquake Table updates as well.