Debugging Java Programs

This topic describes the procedure to debug Java programs in Oracle® Database Navigator.

As part of OJVM support provided for Oracle Database Navigator plug-in, debugging a Java program running within Oracle databases involves setting up a Java debugger (JDB) listener and connecting to it using the Java Debug Wire Protocol (JDWP). Debugging a Java program through the DBN interface consolidates the following processes:
  1. Opening a listener for "Remote JVM Debug" on the IDE platform.
  2. Giving appropriate privileges to a database schema for:
    • debugging Java program
    • connecting to the Listener
  3. Connecting to the Listener using Java Debug Wire Protocol (JDWP) from the database schema.
  4. Executing the Java program.

Follow these steps to debug a Java program:

  1. From the DB Browser window, expand the Java class (or Java source code) loaded in the database schema.
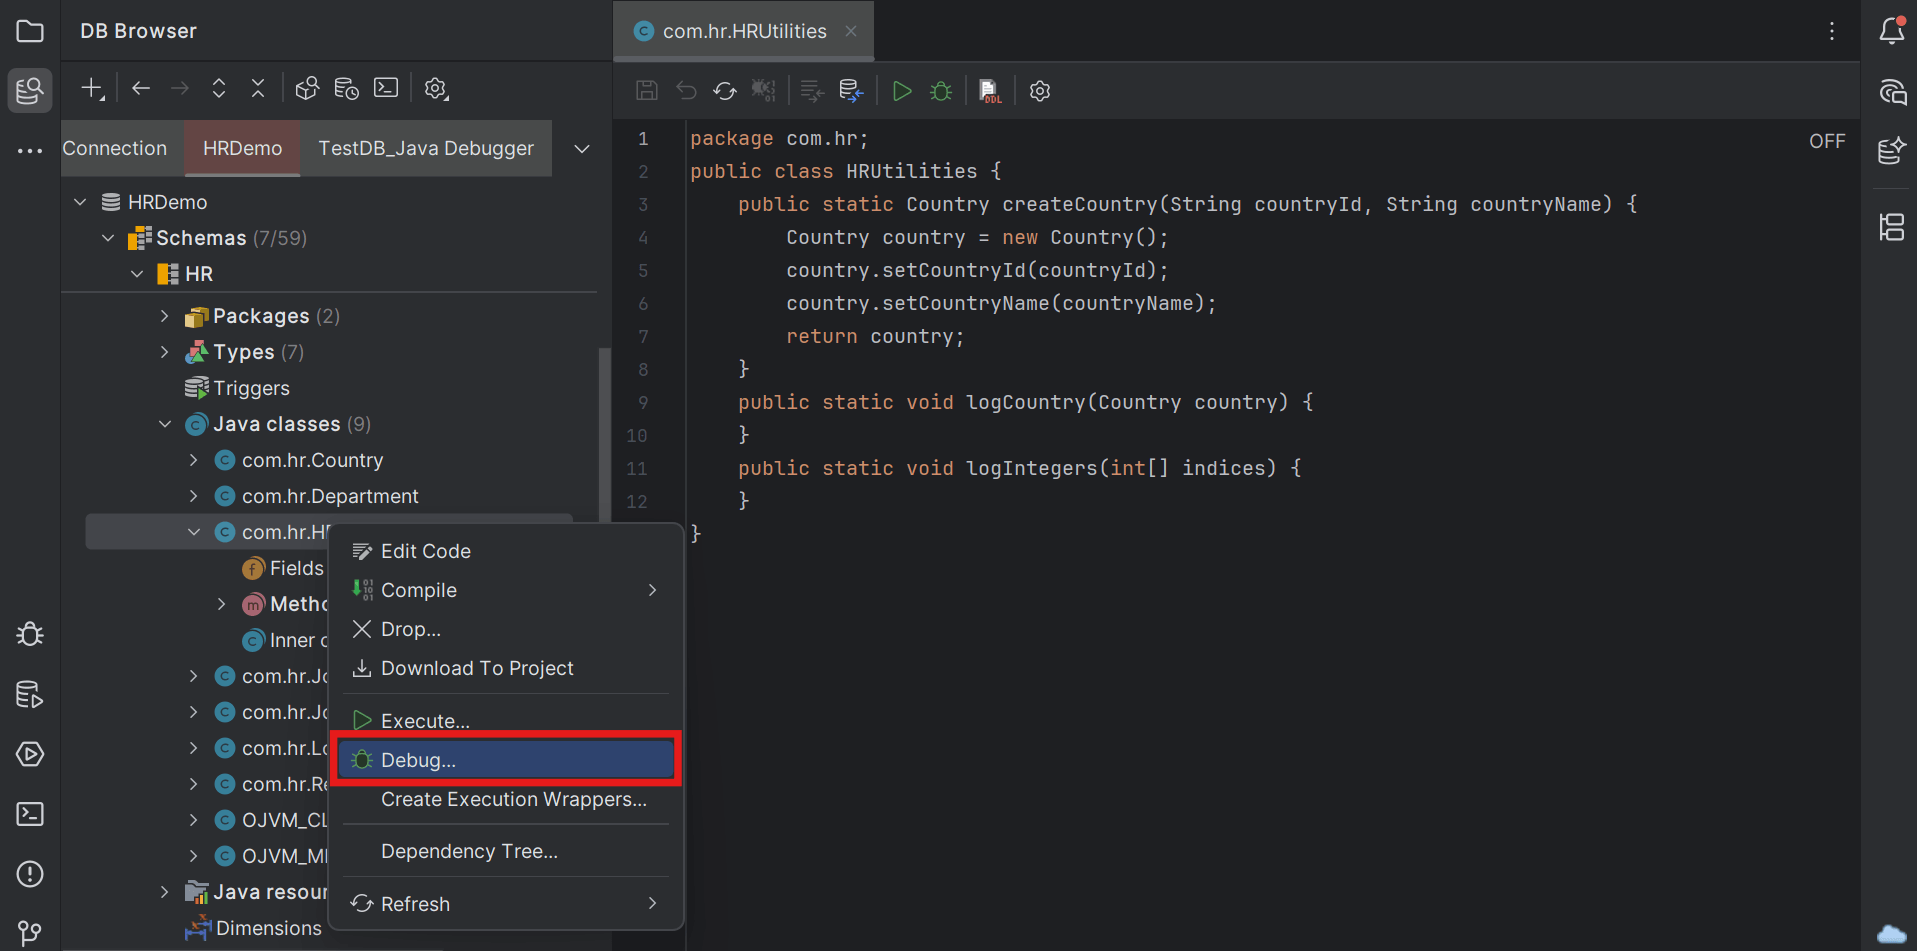
  2. Right-click the Java class file or a method within the Java class and select Debug option from the context menu.

    Debug Java class file

    Alternatively, double click the Java class file to open it in the Java Editor window and from the editor toolbar menu, click the Debug Method icon.


    Debug Java method

  3. Select the public static method that you want to debug in that Java class file.

    The system starts verifying the pre-requisites for performing the debug operation.


    Verifying Java Debug Prerequisites

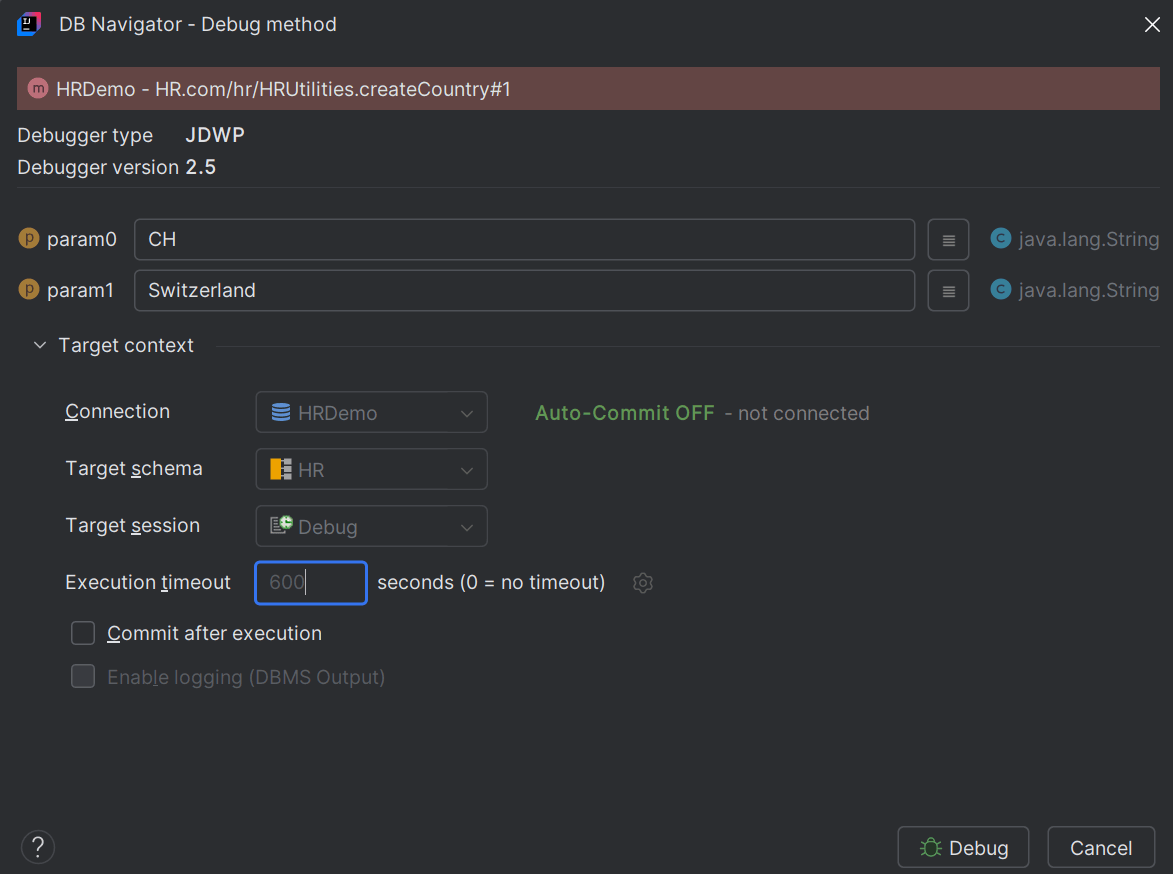
    Once all the required permissions are successfully verified, the DB Navigator - Debug Method window opens displaying the Debugger Type being used and the Debugger Version.


    DB Navigator - Debug Java Method dialog box

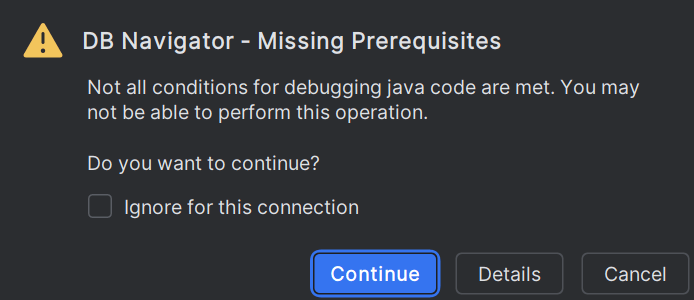
    If you do not have all the pre-requisites met, the DB Navigator - Missing Prerequisites dialog box pops-up with a confirmation message to either continue by ignoring the required privileges for debugging the program or view the required privileges for that connection.


    Missing Prerequisites for Java debugger

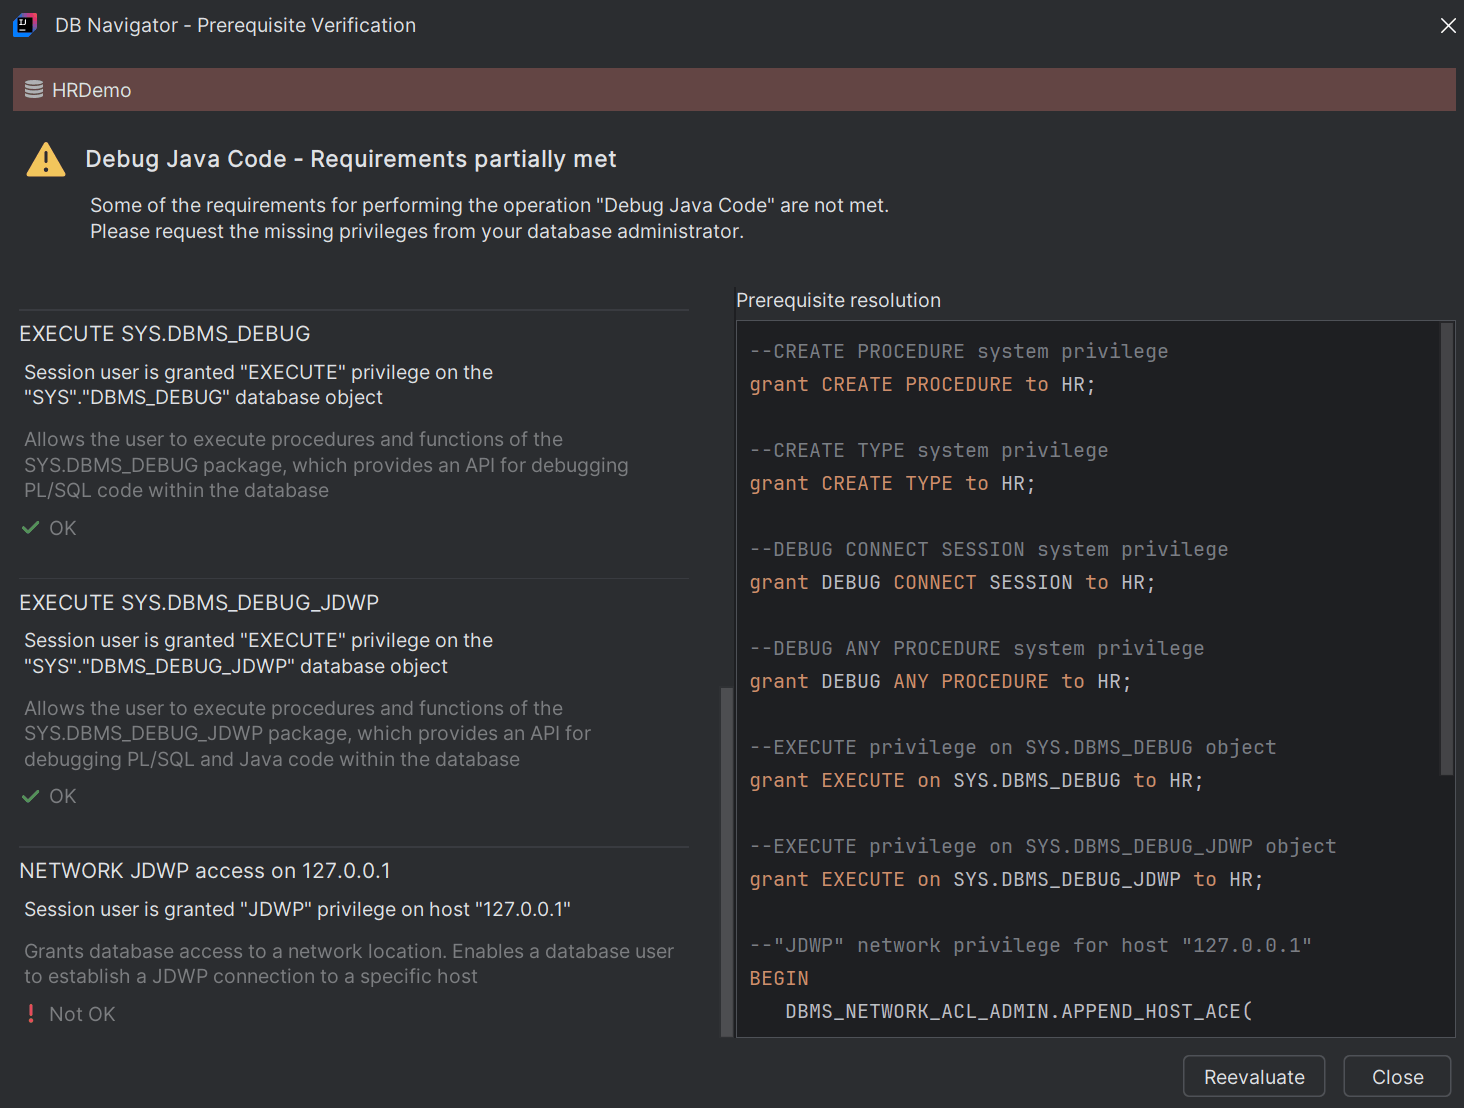
    • Click Details on the dialog box to open the DB Navigator - Prerequisites Verification dialog box that lists all the required permissions for debugging the Java code. Contact your database administrator to provide you the required privileges.


      DB Navigator - Prerequisite Verification dialog box

    • Click Continue to proceed with the debugging session without the required privileges.
  4. In the DB Navigator - Debug Method window, enter the input parameter values in the text box(es). The defined data type for the input parameters are mentioned next to the text boxes. Clicking the Open Value History icon next to the text box displays the history of input parameter values previously used for executing/debugging the Java method for you to select.
    • In the Target Context section, the target database connection, schema and session information is provided. The Target Session by default is the "Debug" session.
    • Set the Execution timeout duration in seconds (duration for running the target Java program), if you do not want the default time configured in the Execution Engine settings. Click the Settings icon to set the custom execution timeout duration as the configured time for all debug sessions.
    • Select the Commit after execution check box to auto-commit the execution transactions to the database.
  5. Click Debug. The debug session starts, and the processes are listed on the Debug Console window. The Debug Console displays the following tabs:
    • Threads & Variables - displays the list of live threads (expressions) and variables along with the watches added to the variables. You can evaluate and switch between threads and also add a watch to analyze the state of the program.


      Java Debug output window - Threads and Variables tab

    • Console - displays the program output in addition to the debugger output and the debugger session status messages.


      Java Debug output window - Console tab