Debugging Methods

This topic describes the procedure to debug PL/SQL methods in Oracle® Database Navigator.

Debugging a PL/SQL program through Oracle® Database Navigator plug-in uses the execution engine and attaches the debugger agent to target process. If the run configuration in your IDE supports debugging and the method is compiled in debug mode, a green bug icon displays next to the object in the DB Browser window, indicating that you can run the program in debug mode.

Follow these steps to debug a PL/SQL method:

  1. Right-click the method on the DB Browser window and select Debug from the context menu. Alternatively, double-click the method to open it in the editor window and then click the Debug Method icon from the editor toolbar menu.
    A confirmation dialog box to select the debugger engine type to use pops up. This confirmation message only appears if the default debug engine type is not already configured to either JDBC or JDWP methods.


    DB Navigator - Debugger Type to use dialog box

    Note:

    You can choose to first compile the function or procedure by selecting Compile > Compile Function/Compile Procedure from the context menu of the method and then select Debug, or the Compile Function (Debug)/Compile Procedure (Debug) option.
  2. Select the Debugger Type (JDWP over TCP or Classic over JDBC) to initiate the debug session.

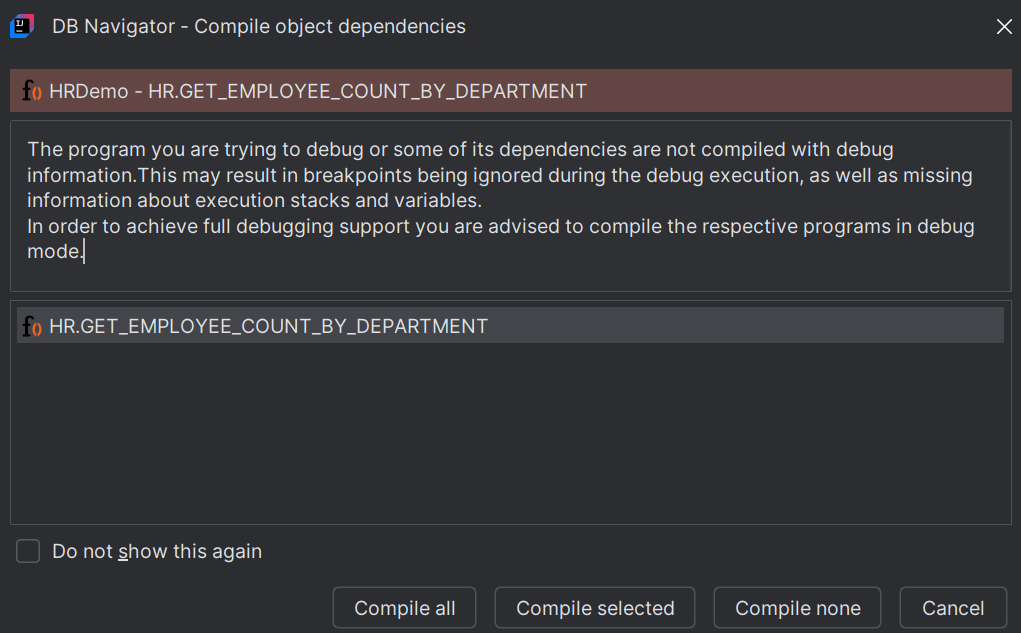
    If the method or any of its dependencies are not compiled, the debug execution can result in inconsistencies. You will be prompted to first compile the program you are trying to debug.


    DB Navigator - Compile object dependencies dialog box

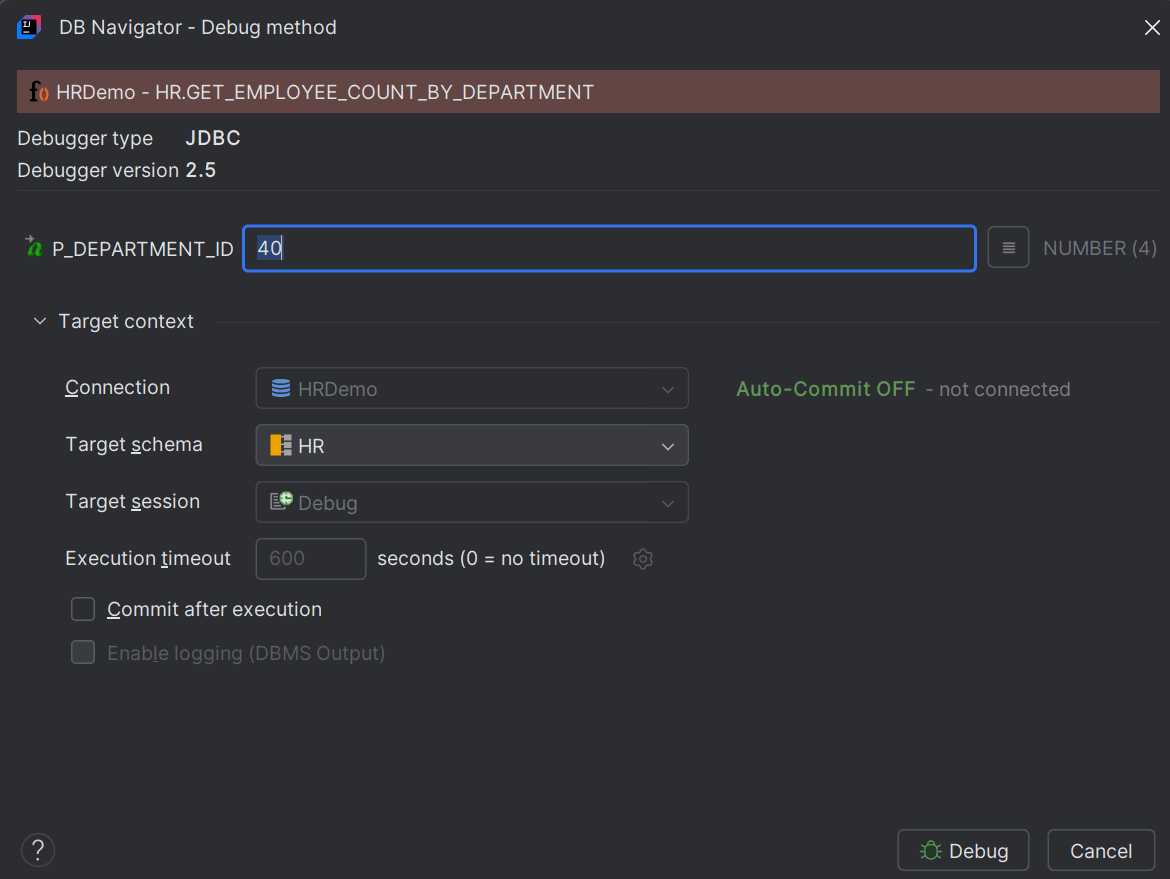
  3. Select Compile all or Compile selected to start compiling dependencies for program execution. The DB Navigator - Debug Method dialog box opens with the name of the method being debugged and the selected Debugger Type and Debugger version specified.

    DB Navigator - Debug Method dialog box

  4. Enter values in the input parameter text box(es). The permissible character type and max character length is mentioned next to the input parameter(s).
    Clicking the Possible Values icon next to the text box displays the stored history for that parameter (previous input values used for executing the method) that you can select.
    • In the Target Context section, the target database connection, schema and session information is provided. You can change the Target Schema to execute and debug the method.
    • Set the Execution timeout duration in seconds, if you do not want the default time configured in the Execution Engine settings.
    • Select the Commit after execution check box to auto-commit the execution transactions to the database.
  5. Click Debug.
    The debugger session starts, and the processes are listed on the Debug console window.
    The Debug console displays the following tabs:
    • Threads & Variables - displays the list of live threads (expressions) and variables along with the watches added to the variables. You can evaluate and switch between threads and also add a watch to analyze the program state.


      PLSQL Debug Console window- Threads and Variables tab

    • Console - displays the program output in addition to the debugger output (such as log messages from breakpoints)


      Debung Console tab with debug session details