View an Experiment
In the AutoML UI Experiments page, all the experiments that you have created are listed. Each experiment will be in one of the following stages: Completed, Running, and Ready.
To view an experiment, click the experiment name. The Experiment page displays the details of the selected experiment. It contains the following sections:
Edit Experiment
In this section, you can edit the selected experiment. Click Edit to make edits to your experiment.
Note: You cannot edit an experiment that is running.
Metric Chart
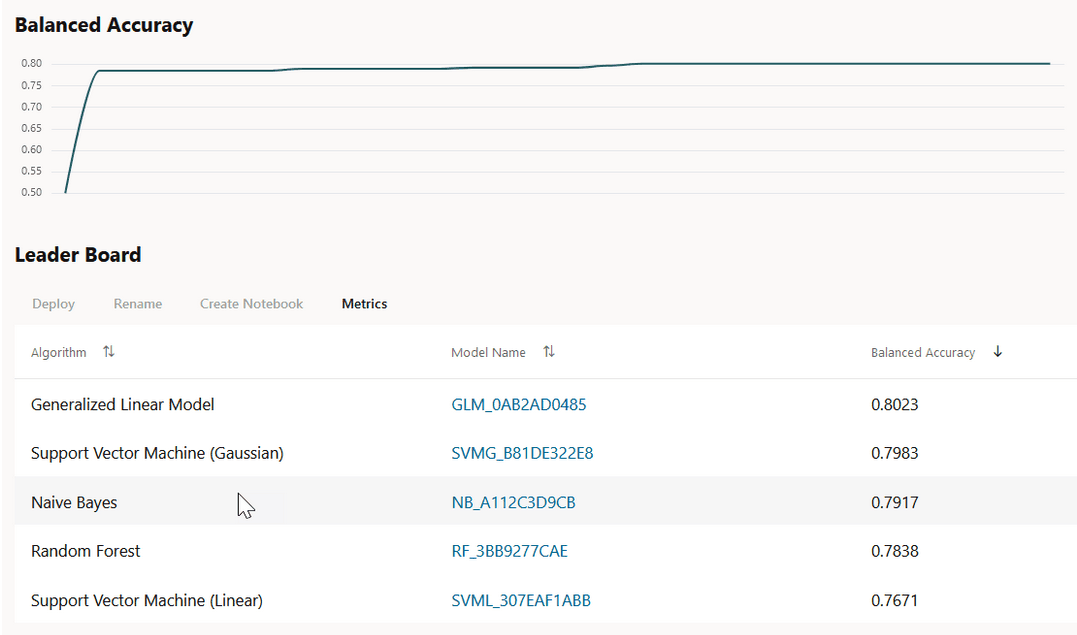
The Model Metric Chart depicts the best metric value over time as the experiment runs. It shows improvement in accuracy as the running of the experiment progresses. The display name depends on the selected model metric when you create the experiment.
Leader Board
When an experiment runs, it starts to show the results in the Leader Board. The Leader Board displays the top performing models relative to the model metric selected along with the algorithm and accuracy. You can view the model details and perform the following tasks:
Figure 10: Leader Board
Description of the illustration leaderboard.png
-
View Model Details: Click on the Model Name to view the details. The model details are displayed in the Model Details dialog box. You can click multiple models on the Leader Board, and view the model details simultaneously. The Model Details window depicts the following:
-
Prediction Impact: Displays the importance of the attributes in terms of the target prediction of the models.
-
Confusion Matrix: Displays the different combination of actual and predicted values by the algorithm in a table. Confusion Matrix serves as a performance measurement of the machine learning algorithm.
-
-
Deploy: Select any model on the Leader Board and click Deploy to deploy the selected model. Deploy Model.
-
Rename: Click Rename to change the name of the system generated model name. The name must be alphanumeric (not exceeding 123 characters) and must not contain any blank spaces.
-
Create Notebook: Select any model on the Leader Board and click Create Notebooks from AutoML UI Models to recreate the selected model from code.
-
Metrics: Click Metrics to select additional metrics to display in the Leader Board. The additional metrics are:
-
For Classification
-
Accuracy: Calculates the proportion of correctly classifies cases - both Positive and Negative. For example, if there are a total of TP (True Positives)+TN (True Negatives) correctly classified cases out of TP+TN+FP+FN (True Positives+True Negatives+False Positives+False Negatives) cases, then the formula is:
Accuracy = (TP+TN)/(TP+TN+FP+FN) -
Balanced Accuracy: Evaluates how good a binary classifier is. It is especially useful when the classes are imbalanced, that is, when one of the two classes appears a lot more often than the other. This often happens in many settings such as Anomaly Detection etc.
-
Recall: Calculates the proportion of actual Positives that is correctly classified.
-
Precision: Calculates the proportion of predicted Positives that is True Positive.
-
F1 Score: Combines precision and recall into a single number. F1-score is computed using harmonic mean which is calculated by the formula:
F1-score = 2 × (precision × recall)/(precision + recall)
-
-
For Regression:
-
R2 (Default): A statistical measure that calculates how close the data are to the fitted regression line. In general, the higher the value of R-squared, the better the model fits your data. The value of R2 is always between 0 to 1, where:
-
0indicates that the model explains none of the variability of the response data around its mean. -
1indicates that the model explains all the variability of the response data around its mean.
-
-
Negative Mean Squared Error: This is the mean of the squared difference of predicted and true targets.
-
Negative Mean Absolute Error: This is the mean of the absolute difference of predicted and true targets.
-
Negative Median Absolute Error: This is the median of the absolute difference between predicted and true targets.
-
-
Features
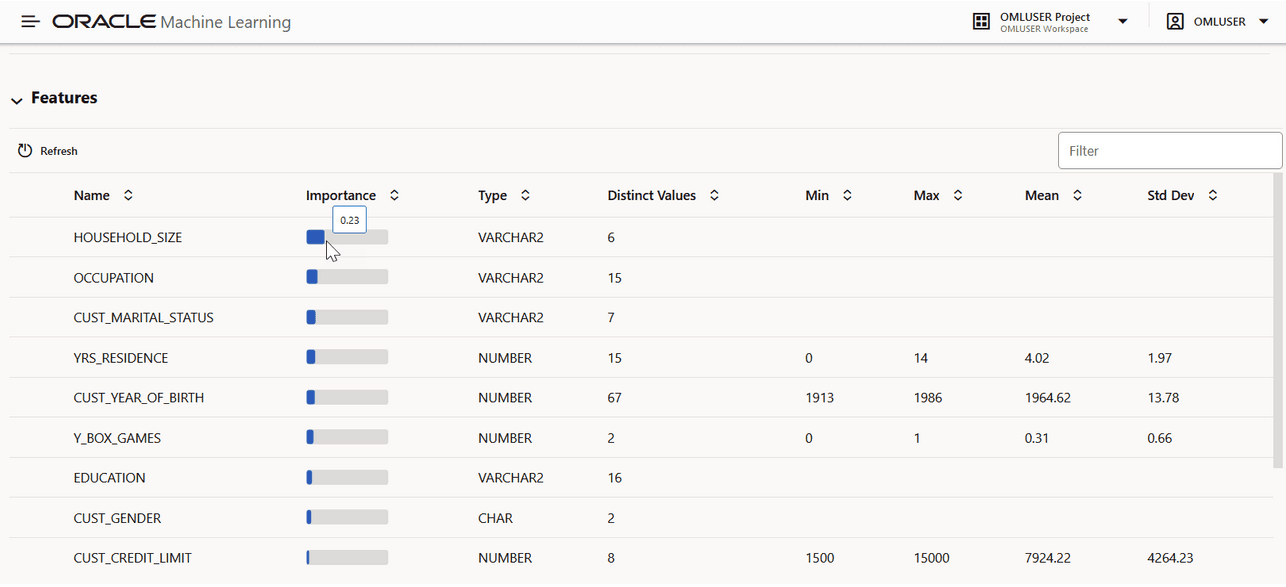
The Features grid displays the statistics of the selected table for the experiment.The supported statistics are Distinct Values, Minimum, Maximum, Mean, and Standard Deviation. The supported data sources for Features are tables, views and analytic views. The target column that you selected in Predict is highlighted here. After an experiment run is completed, the Features grid displays an additional column Importance. Feature Importance indicates the overall level of sensitivity of prediction to a particular feature. Hover your cursor over the graph to view the value of Importance. The value is always depicted in the range 0 to 1, with values closer to 1 being more important.
Figure 11: Features
Description of the illustration feature-importance.png
- Create Notebooks from AutoML UI Models
You can create notebooks using OML4Py code that will recreate the selected model using the same settings. It also illustrates how to score data using the model. This option is helpful if you want to use the code to re-create a similar machine learning model.
Create Notebooks from AutoML UI Models
You can create notebooks using OML4Py code that will recreate the selected model using the same settings. It also illustrates how to score data using the model. This option is helpful if you want to use the code to re-create a similar machine learning model.
To create a notebook from an AutoML UI model:
-
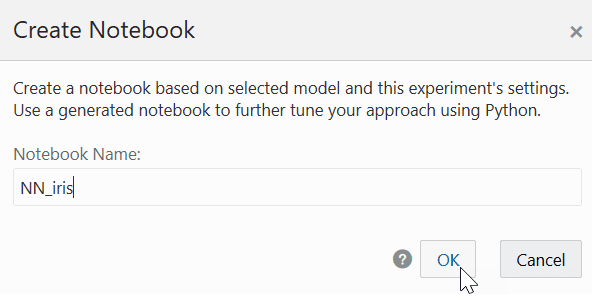
Select the model on the Leader Board based on which you want to create your notebook, and click Create Notebook. The Create Notebook dialog opens.
Figure 12: Create Notebook dialog
-
In the Notebook Name field, enter a name for your notebook.
The REST API endpoint derives the experiment metadata, and determines the following settings as applicable:
-
Data Source of the experiment (schema.table)
-
Case ID. If the Case ID for the experiment is not available, then the appropriate message is displayed.
-
A unique model name based on the current model name is generated
-
Information related to scoring paragraph:
-
Case ID: If available, then it merges the Case ID column into the scoring output table
-
Generate unique predict output table name based on build data source and unique suffix
-
Prediction column name: PREDICTION
-
Prediction probability column name: PROBABILITY (applicable only for Classification)
-
-
-
Click OK. The generated notebook is listed in the Notebook page. Click to open the notebook
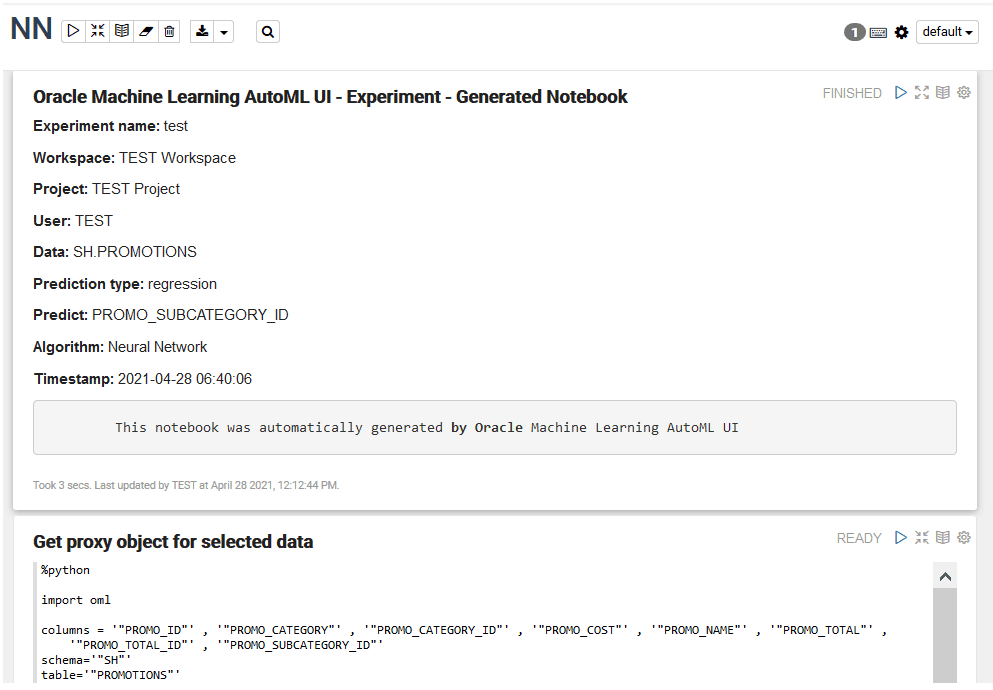
The generated notebook displays paragraph titles for each paragraph along with the python codes. Once you run the notebook, it displays information related to the notebook as well as the AutoML experiment such as the experiment name, workspace and project in which the notebook is present, the user, data, prediction type and prediction target, algorithm, and the time stamp when the notebook is generated.
Figure 13: AutoML UI Generated notebook
Description of the illustration automl-ui-generated-notebook.png