A model monitor helps you monitor several compatible models, and compute the model drift chart. Compatible models refer to those models that are trained on the same target and mining function. The model drift chart consists of multiple series of data drift points, one for each monitored model.
A model monitor can optionally monitor data to provide additional insight. This additional insight is the Drift Feature Importance versus Predictive Feature Impact chart which is generated when you select the Monitor Data option while creating the model monitor.
This topic discusses hows how to create a model monitor. The example uses the
Individual household electricity consumption dataset which includes various
consumption metrics of a household for the year 2009. The data is split into seasons -
SPRING, SUMMER, FALL, and WINTER. The goal is to understand if and how household
consumption has changed over the seasons. The example shows how to track the effects of
data drifts on model predictive accuracy.
The dataset comprises the following columns:
DATE_TIME — Contains the date and time related information in dd:mm:yyyy:hh:mm:ss format.
GLOBAL_ACTIVE_POWER — This is the household global minute-averaged active power (in kilowatt).
GLOBAL_REACTIVE_POWER — This is the household global minute-averaged reactive power (in kilowatt).
VOLTAGE — This is the Minute-averaged voltage (in volt).
GLOBAL_INTENSITY — This is the household global minute-averaged current intensity (in ampere).
SUB_METERING_1 — This is the energy sub-metering No. 1 (in watt-hour of active energy). It corresponds to the kitchen.
SUB_METERING_2 — This is the energy sub-metering No. 2 (in watt-hour of active energy). It corresponds to the laundry room.
SUB_METERING_3 — This is the energy sub-metering No. 2 (in watt-hour of active energy). It corresponds to an electric water heater and air conditioner.
To create a model monitor:
- On the Oracle Machine Learning UI left navigation menu, expand Monitoring and then click Models to open the Model Monitoring page. Alternatively, you can click on the Model Monitoring icon to open the Model Monitoring page.
- On the Model Monitoring page, click Create to open the New Model Monitor page.
- On the New Model Monitor page, enter the following details:
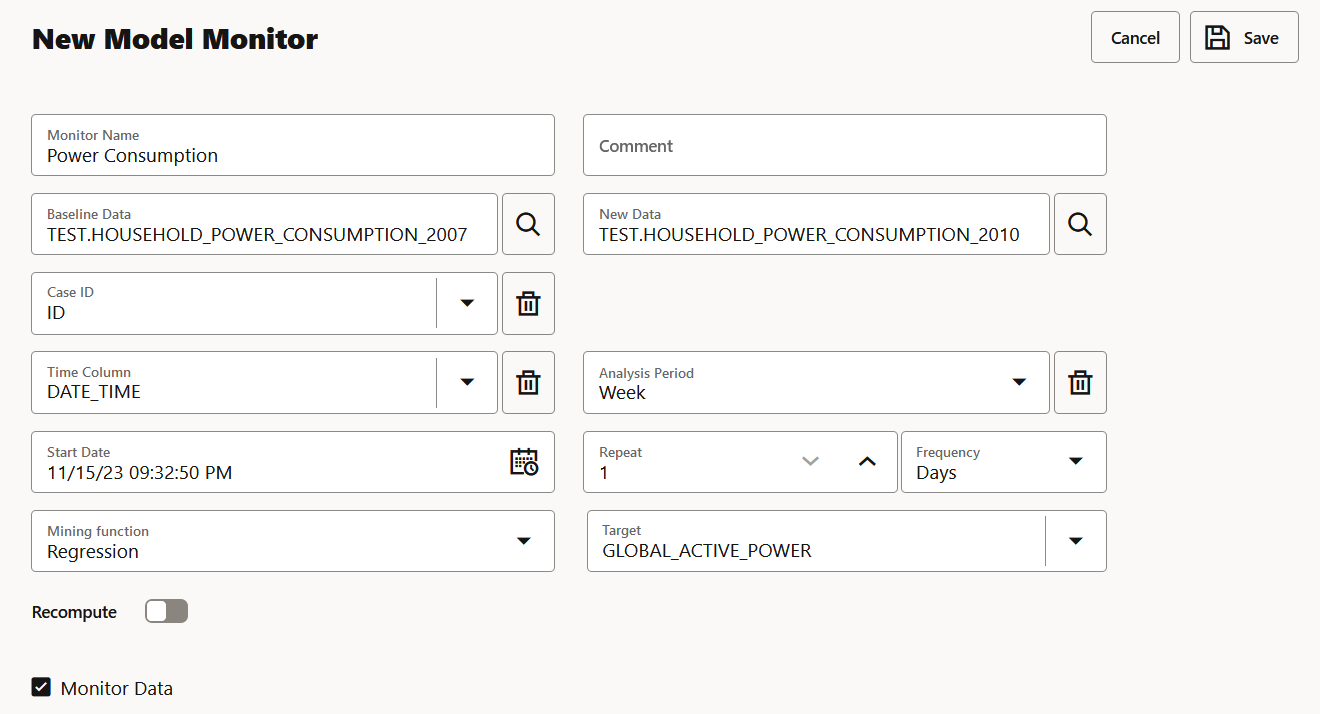
- Monitor Name: Enter a name for the model monitor. Here, the name Power Consumption is used.
- Comment: Enter comments. This is an optional field.
- Baseline Data: This is a table or view that contains baseline data to monitor. Click the search icon to open the Select Table dialog. Select a schema, and then a table. Here, the table containing the data for the year 2007 is selected.
- New Data: This is a table or view with new data
to be compared against the baseline data. Click the search icon to open
the Select Table dialog. Select a schema, and
then a table. Here, the table containing the data for the year 2009 is
selected.
- Case ID: This is an optional field. Enter a case identifier for the baseline and new data to improve the repeatability of the results.
- Time Column: This is the name of a column storing time information in the New Data table or view. The
DATE_TIME column is selected from the drop-down list.
Note:
If the Time Column is blank, the entire New
Data is treated as one period.
- Analysis Period: This is the length of time for which model monitoring is performed on the New Data. Select the analysis period for model monitoring. The options are
Day, Week, Month, Year.
- Start Date: This is the start date of your model monitor schedule. If you do not provide a start date, the current date will be used as the start date.
- Repeat: This value defines the number of times the model monitor run will be repeated for the frequency defined. Enter a number between 1 and 99. For example, if you enter 2 in the Repeat field here, and Minutes in the Frequency field, then the model monitor will run every 2 minutes.
- Frequency: This value determines how frequently the model monitor run will be performed on the New Data. Select a frequency for model monitoring. The options are Minutes, Hours, Days, Weeks, Months. For example, if you select
Minutes in the Frequency field, 2 in the Repeat field, and 5/30/23 in the Start Date field, then as per the schedule, the model monitor will run from 5/30/23 every 2 minutes.
- Mining Function: The available mining functions are
Regression and Classification. Select a function as applicable. In this example, Regression is selected.
- Target: Select an attribute from the drop-down list. In this example,
GLOBAL_ACTIVE_POWER is used as the target for regression models.
- Recompute: Select this option to update the already computed periods. This means that only time periods not present in the output result table will be computed. By default, Recompute is disabled.
- When enabled, the drift analysis is performed for the time period specified in the Start Date field and the end time. The analysis will overwrite the already existing results for the specified time period. This means that the analysis will be computed for the time period with new data other than the current data.
- When disabled, the data for the time period that is present in the results table will be retained as is. Only the new data for the most recent time period will be considered for analysis, and the results will be added to the results table.
- Monitor Data: Select this option to enable data monitoring for the specified data. When enabled, a data monitor is also created along with the model monitor to compute the Predictive Feature Impact versus Drift Feature Impact in the model specific results.
- Click Additional Settings to expand this section and provide advanced settings for your model monitor:
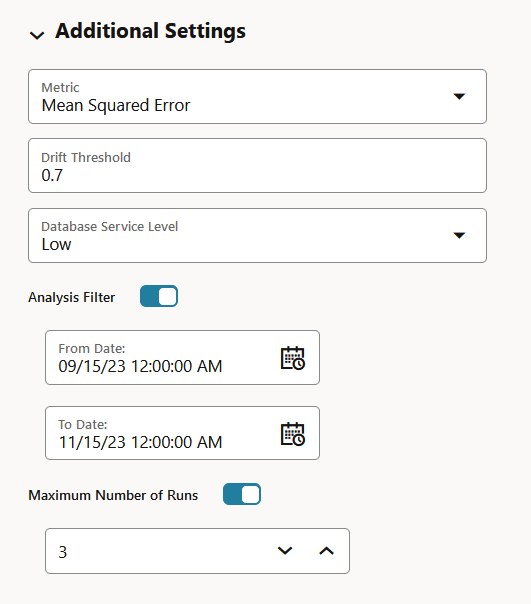
- Metric: Depending on the mining function selected in the Mining Function field in the Create Model Monitor page, the applicable metrics are listed. Click on the drop-down list to select a metric.
For the mining function Classification, the metrics are:
For multi-class classification, the metrics are:
- Accuracy
- Balanced Accuracy
- Macro_F1
- Macro_Precision
- Macro_Recall
- Weighted_F1
- Weighted_Precision
- Weighted_Recall
For Regression, the metrics are:
- R2 — A statistical measure that calculates how close the data are to the fitted regression line. In general, the higher the value of R-squared, the better the model fits your data. The value of R2 is always between 0 to 1, where:
0 indicates that the model explains none of the variability of the response data around its mean.
1 indicates that the model explains all the variability of the response data around its mean.
- Mean Squared Error — This is the mean of the squared difference of predicted and true targets.
- Mean Absolute Error — This is the mean of the absolute difference of predicted and true targets.
- Median Absolute Error — This is the median of the absolute difference between predicted and true targets.
- Drift Threshold: Drift captures the relative change in performance between the baseline data and the new data period. Based on your specific machine learning problem, set the threshold value for your model drift detection. The default is
0.7.
- A drift above this threshold indicates a significant change in model predictions. Exceeding the threshold indicates that rebuilding and redeploying your model may be necessary.
- A drift below this threshold indicates that there are insufficient changes in the data to warrant further investigation or action.
- Database Service Level: This is the service
level for the job, which can be LOW, MEDIUM, HIGH, or GPU.
- Analysis Filter: Enable this option if you want the model monitoring analysis for a specific time period. Move the slider to the right to enable it, and then select a date in From Date and To Date fields respectively. By default, this field is disabled.
- From Date: This is the start date or timestamp of monitoring in New Data. It assumes the existence of a time column in the table. This is a mandatory field if you use the Analysis Filter option.
- To Date: This is the end date or timestamp of monitoring in the New Data. It assumes the existence of a time column in the table. This is a mandatory field if you use the Analysis Filter option.
- Maximum Number of Runs: This is the maximum number of times the model monitor can be run according to this schedule. The default is
3.
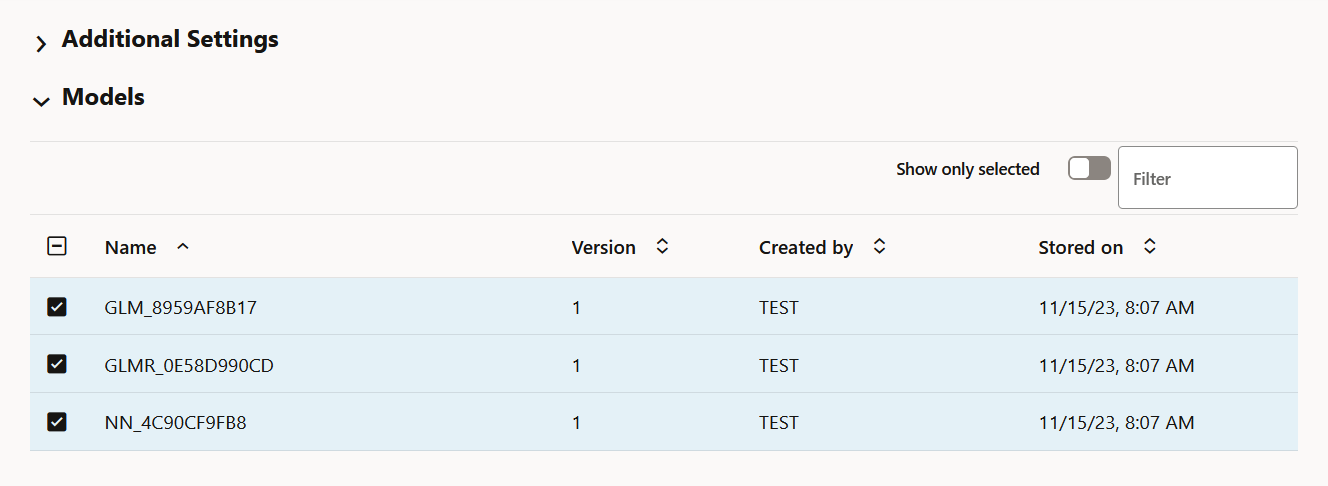
- In the Models section, select the model that you want to monitor and then click Save on the top right corner of the page. Once you provide a value in the Mining Function and Target fields, the list of models that have been deployed are obtained and is displayed here in the Models section. Models are deployed from the Models page, or from the AutoML Leaderboard. You can view the complete list of deployed models in the Deployments tab on the Models page. The deployed models are managed by OML Services.
Note:
If you drop any models, you have to redeploy the models. Models are not schema based models, but models deployed to OML Services.
Once the model monitor is successfully created, it displays the message:
Model monitor has been created successfully.
Note:
You must now go to the Model Monitoring page, select the model monitor and click
Start to begin model monitoring.


