10.14 Orthogonal partitioning clustering (O-Cluster)
O-Cluster is a fast, scalable grid-based clustering algorithm well-suited for analysing large, high-dimensional data sets. The algorithm can produce high quality clusters without relying on user-defined parameters.
Build an O-Cluster model that uses a fast, scalable, grid-based clustering algorithm well-suited for analysing large, high-dimensional data sets. The algorithm can produce high-quality clusters without relying on user-defined parameters.
O-Cluster identifies dense regions in the data and separates those regions into clusters. It does this using axis-parallel, one-dimensional (orthogonal) projections to locate areas of high density, then selects split points that form distinct, non-overlapping clusters that are reasonably balanced in size.
The algorithm works recursively, building a binary tree hierarchy of partitions. The final (leaf) clusters are determined automatically, though you can configure the algorithm to enforce a maximum number of clusters. See O-Cluster for more information.
Settings for O-Cluster Model
The following table lists settings that apply to O-Cluster models.
| Setting | Description | Default Value |
|---|---|---|
CLUS_NUM_CLUSTERS |
Specifies the maximum number of leaf clusters that the algorithm attempts to create. The actual number of clusters may be less than the specified value depending on the characteristics of the data. | Algorithm determined |
OCLT_SENSITIVITY |
Controls the sensitivity of the clustering process. Higher values typically produce a larger number of smaller, more specialized clusters, while lower values produce fewer, larger clusters. Valid values range from 0 to 1. | 0.5 |
PREP_AUTO |
Specifies whether Automatic Data Preparation (ADP) is performed before model building. When enabled, Oracle Machine Learning automatically prepares the input data by handling missing values and applying other preprocessing operations as needed. | ON |
Example 10-14 Using the oml.oc Class
This example builds an O-Cluster model in OML4Py by syncing and joining
customer demographic data, applying automatic data preparation, and fitting the
clustering model on the feature columns (excluding CUST_ID).
import oml
import matplotlib.pyplot as plt

# Sync tables from database queries
SUPPLEMENTARY_DEMOGRAPHICS = oml.sync(query = "select CUST_ID, EDUCATION, OCCUPATION, HOUSEHOLD_SIZE, YRS_RESIDENCE from SH.SUPPLEMENTARY_DEMOGRAPHICS")

CUSTOMERS = oml.sync(query = "select CUST_ID, CUST_GENDER, CUST_YEAR_OF_BIRTH, CUST_MARITAL_STATUS from SH.CUSTOMERS")

# Merge the two DataFrames on CUST_ID
CUST_DF = SUPPLEMENTARY_DEMOGRAPHICS.merge(CUSTOMERS, on="CUST_ID")

CUST_DF.head()

# Drop the model if it exists
oml.drop(model='OC_CLUSTERING_MODEL')

# Define settings
settings = {
    'PREP_AUTO': 'ON',
    'OCLT_SENSITIVITY': 0.5}

# Create and fit the model
OC_MOD = oml.oc(n_clusters=5, **settings)
OC_MOD.fit(CUST_DF.drop('CUST_ID'), model_name='OC_CLUSTERING_MODEL')

# Display model parameters/settings
print("Model Parameters and Settings")
print(OC_MOD.get_params(deep=True))
print()

# Access specific model attributes
print("Cluster Information")
print(OC_MOD.clusters)
print()

print("Cluster Taxonomy (Parent/Child Relationships)")
print(OC_MOD.taxonomy)
print()

print("Cluster Centroids")
print(OC_MOD.centroids)
print()

print("Split Predicates")
print(OC_MOD.split_predicates)
print()

print("Cluster Histograms")
print(OC_MOD.cluster_hists)
print()

print("Cluster Assignment Rules")
print(OC_MOD.rules)

# Rules show the conditions (attribute ranges) that determine cluster membership
# Each rule includes support (how many records match) and confidence (probability)

OC_MOD.rules

# Get cluster information
clusters_data = OC_MOD.clusters.pull()

# Filter for leaf clusters only (those without children)
leaf_clusters = clusters_data[clusters_data['CLUSTER_ID'].isin(
    OC_MOD.centroids.pull()['CLUSTER_ID'].unique()
)]

plt.figure(figsize=(10, 6))
plt.bar(leaf_clusters['CLUSTER_ID'].astype(str), leaf_clusters['RECORD_COUNT'])
plt.xlabel('Cluster ID')
plt.ylabel('Number of Records')
plt.title('Cluster Size Distribution')
plt.tight_layout()
plt.show()

# O-Cluster builds a hierarchical tree structure by recursively splitting data
# This visualization shows how the algorithm divided the customer data into clusters


# Get taxonomy and clusters data
taxonomy_data = OC_MOD.taxonomy.pull()
clusters_data = OC_MOD.clusters.pull()

# Create a simple tree visualization
fig, ax = plt.subplots(figsize=(12, 8))

# Plot each cluster at its tree level
for idx, row in clusters_data.iterrows():
    x = row['CLUSTER_ID']
    y = -row['TREE_LEVEL']  # Negative so root is at top
    size = row['RECORD_COUNT'] / 10  # Scale size by record count
    ax.scatter(x, y, s=size, alpha=0.6)
    ax.text(x, y, str(row['CLUSTER_ID']), ha='center', va='center')

ax.set_xlabel('Cluster ID')
ax.set_ylabel('Tree Level')
ax.set_title('Cluster Hierarchy (size = record count)')
plt.tight_layout()
plt.show()

OC_PRED = OC_MOD.predict_proba(CUST_DF, supplemental_cols=CUST_DF['CUST_ID'])

# Display first few rows of predictionss")
OC_PRED.head()

sorted_data = OC_PRED.sort_values(by='PROBABILITY_OF_6', ascending=False).head(10)

result = sorted_data[['CUST_ID', 'PROBABILITY_OF_6']]
result>>> import oml
>>> import matplotlib.pyplot as plt
>>> CUSTOMERS = oml.sync(query = "select CUST_ID, CUST_GENDER, CUST_YEAR_OF_BIRTH, CUST_MARITAL_STATUS from SH.CUSTOMERS")
>>> CUST_DF = SUPPLEMENTARY_DEMOGRAPHICS.merge(CUSTOMERS, on="CUST_ID")
>>> CUST_DF.head()
CUST_ID EDUCATION_l OCCUPATION_l HOUSEHOLD_SIZE_l YRS_RESIDENCE_l CUST_GENDER_r CUST_YEAR_OF_BIRTH_r CUST_MARITAL_STATUS_r
0 101649 < Bach. Cleric. 1 5 F 1968 never married
1 103119 < Bach. Sales 2 5 F 1964 divorced
2 102831 HS-grad Cleric. 3 5 M 1975 married
3 100939 Assoc-A Farming 3 4 M 1977 married
4 102840 HS-grad Crafts 3 3 M 1986 married
>>> settings = {
... 'PREP_AUTO': 'ON',
... 'OCLT_SENSITIVITY': 0.5}
...
... # Create and fit the model
... OC_MOD = oml.oc(n_clusters=5, **settings)
... OC_MOD.fit(CUST_DF.drop('CUST_ID'), model_name='OC_CLUSTERING_MODEL')
...
Model Name: OC_CLUSTERING_MODEL
Model Owner: OML_USER
Algorithm Name: O_Cluster
Mining Function: CLUSTERING
Settings:
setting name setting value
0 ALGO_NAME ALGO_O_CLUSTER
1 CLUS_NUM_CLUSTERS 5
2 OCLT_SENSITIVITY 0.5
3 ODMS_DETAILS ODMS_ENABLE
4 ODMS_MISSING_VALUE_TREATMENT ODMS_MISSING_VALUE_AUTO
5 ODMS_SAMPLING ODMS_SAMPLING_DISABLE
6 PREP_AUTO ON
Global Statistics:
attribute name attribute value
0 NUM_ROWS 4500
Attributes:
CUST_GENDER_r
CUST_MARITAL_STATUS_r
CUST_YEAR_OF_BIRTH_r
EDUCATION_l
HOUSEHOLD_SIZE_l
OCCUPATION_l
YRS_RESIDENCE_l
Partition: NO
Clusters:
CLUSTER_ID RECORD_COUNT PARENT TREE_LEVEL
0 1 4500 NaN 1
1 2 819 1.0 2
2 3 3681 1.0 2
3 4 2361 3.0 3
4 5 1320 3.0 3
5 6 1139 4.0 4
6 7 1222 4.0 4
7 8 549 5.0 4
8 9 771 5.0 4
Taxonomy:
CLUSTER_ID LEFT_CHILD_ID RIGHT_CHILD_ID
0 1 2.0 3.0
1 2 NaN NaN
2 3 4.0 5.0
3 4 6.0 7.0
4 5 8.0 9.0
5 6 NaN NaN
6 7 NaN NaN
7 8 NaN NaN
8 9 NaN NaN
Split Predicates:
CLUSTER_ID CLUSTER_NAME ATTRIBUTE_NAME ATTRIBUTE_SUBNAME OPERATOR VALUE
0 1 1 CUST_YEAR_OF_BIRTH_r None <= <Element>1960.5</Element>
1 2 2 None None None None
2 3 3 CUST_YEAR_OF_BIRTH_r None <= <Element>1983.73</Element>
3 4 4 OCCUPATION_l None IN <Element>?</Element><Element>House-s</Element>...
4 5 5 OCCUPATION_l None IN <Element>?</Element><Element>Farming</Element>...
5 6 6 None None None None
6 7 7 None None None None
7 8 8 None None None None
8 9 9 None None None None
Centroids:
CLUSTER_ID ATTRIBUTE_NAME ATTRIBUTE_SUBNAME MEAN MODE_VALUE VARIANCE
0 1 CUST_GENDER_r None NaN M NaN
1 1 CUST_MARITAL_STATUS_r None NaN married NaN
2 1 CUST_YEAR_OF_BIRTH_r None 1975.624444 None 187.126764
3 1 EDUCATION_l None NaN HS-grad NaN
4 1 HOUSEHOLD_SIZE_l None NaN 3 NaN
.. ... ... ... ... ... ...
58 9 CUST_YEAR_OF_BIRTH_r None 1990.364462 None 21.517644
59 9 EDUCATION_l None NaN < Bach. NaN
60 9 HOUSEHOLD_SIZE_l None NaN 1 NaN
61 9 OCCUPATION_l None NaN Other NaN
62 9 YRS_RESIDENCE_l None 2.124514 None 0.859801
[63 rows x 6 columns]
Cluster Hists:
CLUSTER_ID CLUSTER_NAME ATTRIBUTE_NAME ATTRIBUTE_SUBNAME BIN_ID LABEL COUNT
0 1 1 CUST_GENDER_r None 1 F 1510
1 1 1 CUST_GENDER_r None 2 M 2990
2 1 1 CUST_MARITAL_STATUS_r None 1 divorced 615
3 1 1 CUST_MARITAL_STATUS_r None 2 married 2034
4 1 1 CUST_MARITAL_STATUS_r None 3 never married 1503
.. ... ... ... ... ... ... ...
724 9 9 YRS_RESIDENCE_l None 11 (9.33333; 10.2667] 0
725 9 9 YRS_RESIDENCE_l None 12 (10.2667; 11.2] 0
726 9 9 YRS_RESIDENCE_l None 13 (11.2; 12.1333] 0
727 9 9 YRS_RESIDENCE_l None 14 (12.1333; 13.0667] 0
728 9 9 YRS_RESIDENCE_l None 15 (13.0667; 14] 0
[729 rows x 7 columns]
Rules:
CLUSTER_ID CLUSTER_NAME ATTRIBUTE_NAME ATTRIBUTE_SUBNAME ... SUPPORT CONFIDENCE RULE_SUPPORT RULE_CONFIDENCE
0 1 1 CUST_GENDER_r None ... 4500 0.000000 3840 0.853333
1 1 1 CUST_GENDER_r None ... 4500 0.000000 3840 0.853333
2 1 1 CUST_MARITAL_STATUS_r None ... 4152 0.400000 3840 0.853333
3 1 1 CUST_MARITAL_STATUS_r None ... 4152 0.400000 3840 0.853333
4 1 1 CUST_MARITAL_STATUS_r None ... 4152 0.400000 3840 0.853333
.. ... ... ... ... ... ... ... ... ...
235 9 9 OCCUPATION_l None ... 743 0.071456 700 0.907912
236 9 9 OCCUPATION_l None ... 743 0.071456 700 0.907912
237 9 9 OCCUPATION_l None ... 743 0.071456 700 0.907912
238 9 9 YRS_RESIDENCE_l None ... 765 0.076983 700 0.907912
239 9 9 YRS_RESIDENCE_l None ... 765 0.076983 700 0.907912
[240 rows x 11 columns]
>>>
>>> # Display model parameters/settings
... print("Model Parameters and Settings")
... print(OC_MOD.get_params(deep=True))
... print()
...
... # Access specific model attributes
... print("Cluster Information")
... print(OC_MOD.clusters)
... print()
...
... print("Cluster Taxonomy (Parent/Child Relationships)")
... print(OC_MOD.taxonomy)
... print()
...
... print("Cluster Centroids")
... print(OC_MOD.centroids)
... print()
...
... print("Split Predicates")
... print(OC_MOD.split_predicates)
... print()
...
... print("Cluster Histograms")
... print(OC_MOD.cluster_hists)
... print()
...
... print("Cluster Assignment Rules")
... print(OC_MOD.rules)
...
Model Parameters and Settings
{'OCLT_SENSITIVITY': '0.5', 'CLUS_NUM_CLUSTERS': '5', 'ALGO_NAME': 'ALGO_O_CLUSTER', 'PREP_AUTO': 'ON', 'ODMS_DETAILS': 'ODMS_ENABLE', 'ODMS_MISSING_VALUE_TREATMENT': 'ODMS_MISSING_VALUE_AUTO', 'ODMS_SAMPLING': 'ODMS_SAMPLING_DISABLE'}
Cluster Information
CLUSTER_ID RECORD_COUNT PARENT TREE_LEVEL
0 1 4500 NaN 1
1 2 819 1.0 2
2 3 3681 1.0 2
3 4 2361 3.0 3
4 5 1320 3.0 3
5 6 1139 4.0 4
6 7 1222 4.0 4
7 8 549 5.0 4
8 9 771 5.0 4
Cluster Taxonomy (Parent/Child Relationships)
CLUSTER_ID LEFT_CHILD_ID RIGHT_CHILD_ID
0 1 2.0 3.0
1 2 NaN NaN
2 3 4.0 5.0
3 4 6.0 7.0
4 5 8.0 9.0
5 6 NaN NaN
6 7 NaN NaN
7 8 NaN NaN
8 9 NaN NaN
Cluster Centroids
CLUSTER_ID ATTRIBUTE_NAME ATTRIBUTE_SUBNAME MEAN MODE_VALUE VARIANCE
0 1 CUST_GENDER_r None NaN M NaN
1 1 CUST_MARITAL_STATUS_r None NaN married NaN
2 1 CUST_YEAR_OF_BIRTH_r None 1975.624444 None 187.126764
3 1 EDUCATION_l None NaN HS-grad NaN
4 1 HOUSEHOLD_SIZE_l None NaN 3 NaN
.. ... ... ... ... ... ...
58 9 CUST_YEAR_OF_BIRTH_r None 1990.364462 None 21.517644
59 9 EDUCATION_l None NaN < Bach. NaN
60 9 HOUSEHOLD_SIZE_l None NaN 1 NaN
61 9 OCCUPATION_l None NaN Other NaN
62 9 YRS_RESIDENCE_l None 2.124514 None 0.859801
[63 rows x 6 columns]
Split Predicates
CLUSTER_ID CLUSTER_NAME ATTRIBUTE_NAME ATTRIBUTE_SUBNAME OPERATOR VALUE
0 1 1 CUST_YEAR_OF_BIRTH_r None <= <Element>1960.5</Element>
1 2 2 None None None None
2 3 3 CUST_YEAR_OF_BIRTH_r None <= <Element>1983.73</Element>
3 4 4 OCCUPATION_l None IN <Element>?</Element><Element>House-s</Element>...
4 5 5 OCCUPATION_l None IN <Element>?</Element><Element>Farming</Element>...
5 6 6 None None None None
6 7 7 None None None None
7 8 8 None None None None
8 9 9 None None None None
Cluster Histograms
CLUSTER_ID CLUSTER_NAME ATTRIBUTE_NAME ATTRIBUTE_SUBNAME BIN_ID LABEL COUNT
0 1 1 CUST_GENDER_r None 2 M 2990
1 1 1 CUST_GENDER_r None 1 F 1510
2 1 1 CUST_MARITAL_STATUS_r None 4 separated 134
3 1 1 CUST_MARITAL_STATUS_r None 3 never married 1503
4 1 1 CUST_MARITAL_STATUS_r None 2 married 2034
.. ... ... ... ... ... ... ...
724 9 9 YRS_RESIDENCE_l None 5 (3.73333; 4.66667] 31
725 9 9 YRS_RESIDENCE_l None 4 (2.8; 3.73333] 229
726 9 9 YRS_RESIDENCE_l None 3 (1.86667; 2.8] 319
727 9 9 YRS_RESIDENCE_l None 2 (.933333; 1.86667] 159
728 9 9 YRS_RESIDENCE_l None 14 (12.1333; 13.0667] 0
[729 rows x 7 columns]
Cluster Assignment Rules
CLUSTER_ID CLUSTER_NAME ATTRIBUTE_NAME ATTRIBUTE_SUBNAME ... SUPPORT CONFIDENCE RULE_SUPPORT RULE_CONFIDENCE
0 1 1 EDUCATION_l None ... 3840 0.625000 3840 0.853333
1 1 1 EDUCATION_l None ... 3840 0.625000 3840 0.853333
2 1 1 EDUCATION_l None ... 3840 0.625000 3840 0.853333
3 1 1 EDUCATION_l None ... 3840 0.625000 3840 0.853333
4 1 1 EDUCATION_l None ... 3840 0.625000 3840 0.853333
.. ... ... ... ... ... ... ... ... ...
235 9 9 CUST_YEAR_OF_BIRTH_r None ... 744 0.080438 700 0.907912
236 9 9 YRS_RESIDENCE_l None ... 765 0.076983 700 0.907912
237 9 9 YRS_RESIDENCE_l None ... 765 0.076983 700 0.907912
238 9 9 CUST_GENDER_r None ... 771 0.003564 700 0.907912
239 9 9 CUST_GENDER_r None ... 771 0.003564 700 0.907912
[240 rows x 11 columns]
>>> OC_MOD.rules
CLUSTER_ID CLUSTER_NAME ATTRIBUTE_NAME ATTRIBUTE_SUBNAME ... SUPPORT CONFIDENCE RULE_SUPPORT RULE_CONFIDENCE
0 1 1 EDUCATION_l None ... 3840 0.625000 3840 0.853333
1 1 1 EDUCATION_l None ... 3840 0.625000 3840 0.853333
2 1 1 EDUCATION_l None ... 3840 0.625000 3840 0.853333
3 1 1 EDUCATION_l None ... 3840 0.625000 3840 0.853333
4 1 1 EDUCATION_l None ... 3840 0.625000 3840 0.853333
.. ... ... ... ... ... ... ... ... ...
235 9 9 CUST_YEAR_OF_BIRTH_r None ... 744 0.080438 700 0.907912
236 9 9 YRS_RESIDENCE_l None ... 765 0.076983 700 0.907912
237 9 9 YRS_RESIDENCE_l None ... 765 0.076983 700 0.907912
238 9 9 CUST_GENDER_r None ... 771 0.003564 700 0.907912
239 9 9 CUST_GENDER_r None ... 771 0.003564 700 0.907912
[240 rows x 11 columns]
>>> # Get cluster information
... clusters_data = OC_MOD.clusters.pull()
...
... # Filter for leaf clusters only (those without children)
... leaf_clusters = clusters_data[clusters_data['CLUSTER_ID'].isin(
... OC_MOD.centroids.pull()['CLUSTER_ID'].unique()
... )]
...
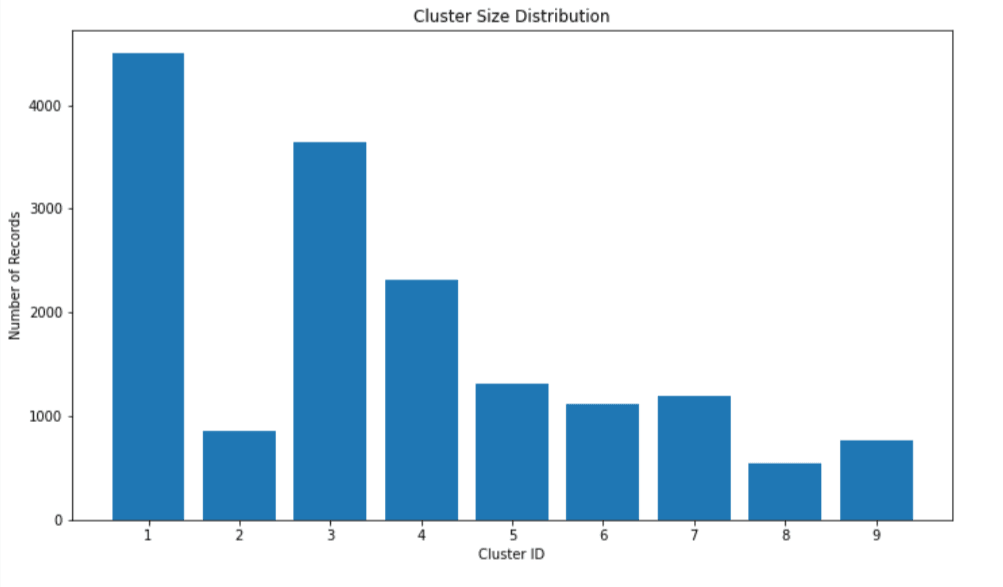
... plt.figure(figsize=(10, 6))
... plt.bar(leaf_clusters['CLUSTER_ID'].astype(str), leaf_clusters['RECORD_COUNT'])
... plt.xlabel('Cluster ID')
... plt.ylabel('Number of Records')
... plt.title('Cluster Size Distribution')
... plt.tight_layout()
... plt.show()
...
Figure 10-1 Cluster Size Distribution
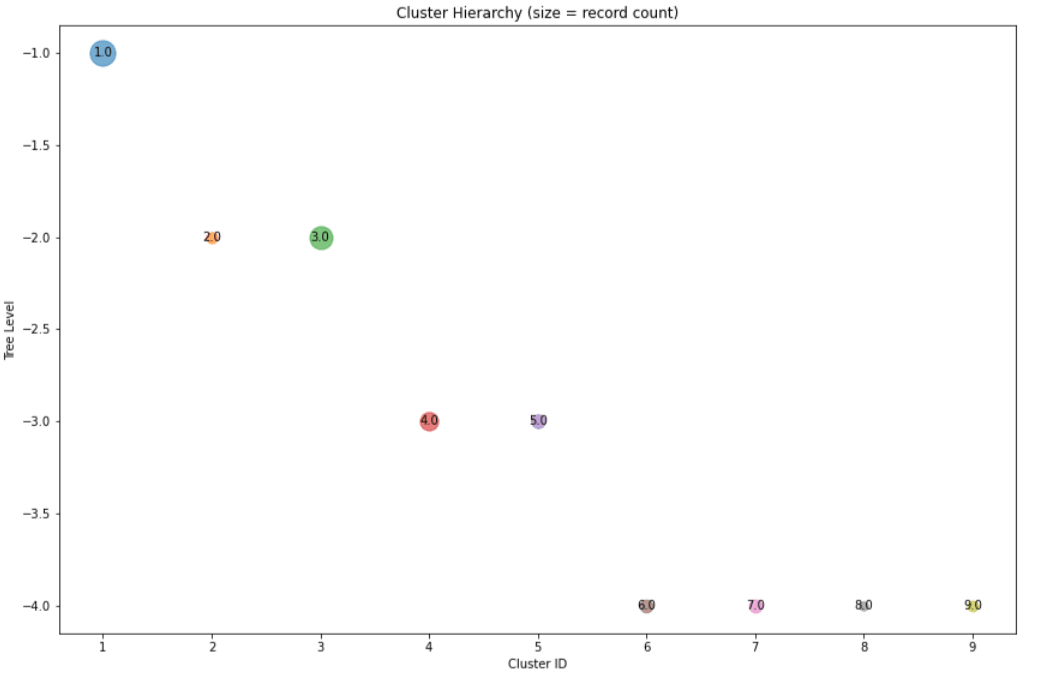
>>> # O-Cluster builds a hierarchical tree structure by recursively splitting data
... # This visualization shows how the algorithm divided the customer data into clusters
...
... # Get taxonomy and clusters data
... taxonomy_data = OC_MOD.taxonomy.pull()
... clusters_data = OC_MOD.clusters.pull()
...
... # Create a simple tree visualization
... fig, ax = plt.subplots(figsize=(12, 8))
...
... # Plot each cluster at its tree level
... for idx, row in clusters_data.iterrows():
...     x = row['CLUSTER_ID']
...     y = -row['TREE_LEVEL']  # Negative so root is at top
...     size = row['RECORD_COUNT'] / 10  # Scale size by record count
...     ax.scatter(x, y, s=size, alpha=0.6)
...     ax.text(x, y, str(row['CLUSTER_ID']), ha='center', va='center')
...
... ax.set_xlabel('Cluster ID')
... ax.set_ylabel('Tree Level')
... ax.set_title('Cluster Hierarchy (size = record count)')
... plt.tight_layout()
... plt.show()
...
Figure 10-2 Cluster Hierarchy (size = record count)
>>> OC_PRED = OC_MOD.predict_proba(CUST_DF, supplemental_cols=CUST_DF['CUST_ID'])
>>> OC_PRED.head()
   CUST_ID  PROBABILITY_OF_2  PROBABILITY_OF_6  PROBABILITY_OF_7  PROBABILITY_OF_8  PROBABILITY_OF_9
0   100001      9.999998e-01      2.138256e-07      5.980863e-13      4.276200e-10      2.580883e-15
1   100002      1.562013e-09      2.284418e-06      9.999945e-01      6.887499e-11      3.198921e-06
2   100003      4.855434e-10      6.290287e-06      9.999919e-01      4.056033e-10      1.797964e-06
3   100004      5.508184e-02      5.913865e-06      9.449122e-01      5.625176e-18      1.539535e-13
4   100005      2.889727e-03      9.971058e-01      4.457944e-06      3.519775e-09      1.949460e-15
>>> sorted_data = OC_PRED.sort_values(by='PROBABILITY_OF_6', ascending=False).head(10)
...
... result = sorted_data[['CUST_ID', 'PROBABILITY_OF_6']]
... result
...
   CUST_ID  PROBABILITY_OF_6
0   103773               1.0
1   101108               1.0
2   103386               1.0
3   100106               1.0
4   103678               1.0
5   100376               1.0
6   101606               1.0
7   103972               1.0
8   101292               1.0
9   101410               1.0