20 Oracle Trace File Analyzer Service
Oracle Trace File Analyzer Service is deployed as part of Domain Service Cluster (DSC) setup.
- Overview of Oracle Trace File Analyzer Service
Oracle Trace File Analyzer service helps DBAs and system administrators proactively monitor trace files across multiple member clusters on a centralized machine. - Cluster or Host View
The cluster or host view shows all clusters in a table heatmap, which you can drill-down to the host level. - Detailed View
Detailed view displays a dashboard with top events represented in a timeline. - File Browser
Oracle Trace File Analyzer Service classifies each trace file and provides an interface to browse files by various classifications. - File Viewer
File viewer opens each file in a new tab. - Merged Files
To find what’s happening in different components at the same time, look at multiple trace files. - Importing CA Certificates into Tomcat
Oracle Trace File Analyzer service starts an Apache Tomcat instance to serve web requests.
20.1 Overview of Oracle Trace File Analyzer Service
Oracle Trace File Analyzer service helps DBAs and system administrators proactively monitor trace files across multiple member clusters on a centralized machine.
Oracle Trace File Analyzer helps the DBAs and system administrators to analyze the data for issues, identify duplicate issues, and predict future failures.
Oracle Trace File Analyzer Service is set up as part of Domain Service Cluster (DSC) setup. You need not run any commands to configure or set up Oracle Trace File Analyzer Service. The service runs on the first node of a cluster.
root:$ tfactl receiver info
TFA Service URL : http://rws1270066:7070/tfa/index.html
TFA Service URL (https) : https://rws1270066:7071/tfa/index.html
TFA Service Admin User : admin
TFA Service Admin Status : active
TFA Service Repository : /scratch/app/oragrid/tfa/repository
TFA Service Port : 7001
TFA Service Members :After the initial setup, web administrator account is locked.
root:$ tfactl receiver reset webadmin20.2 Cluster or Host View
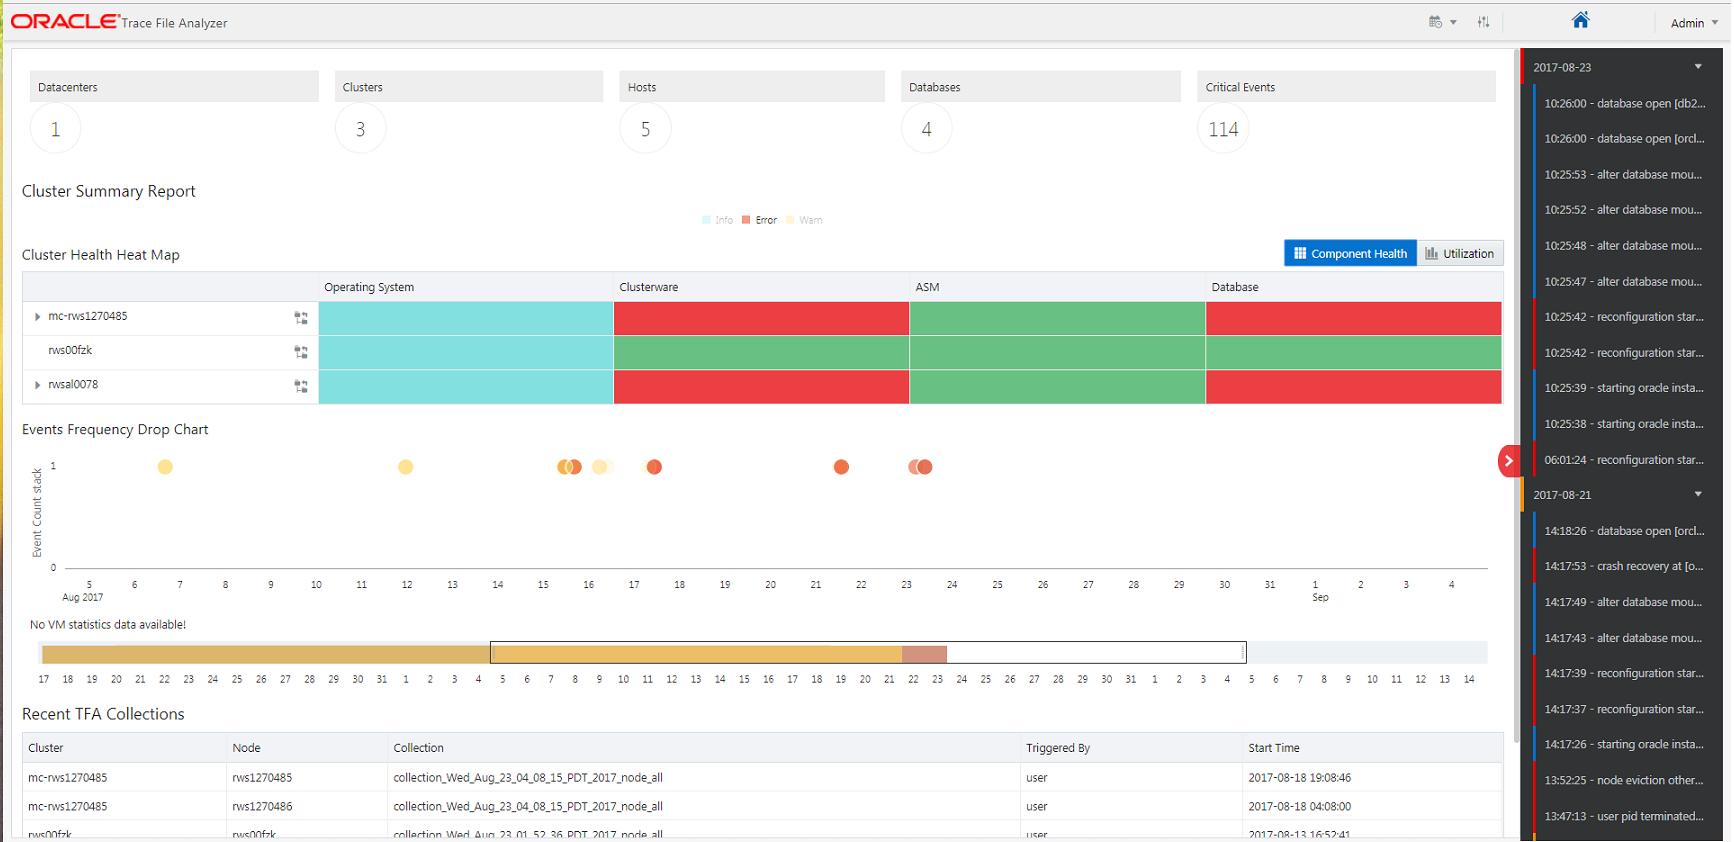
The cluster or host view shows all clusters in a table heatmap, which you can drill-down to the host level.
Clicking on a cluster shows:
-
Configuration of that cluster
-
Status
-
ORACLE_HOMEs -
Version
-
Patch level for each home
-
Databases running from home and their statuses
The y-axis represents cluster or host name and the x-axis represents the health of important components in the cluster.
Metrics view shows the CPU, Memory, Disk usage, and Critical Events from each host on x-axis.
By clicking on a cell, you can drill-down details for the selected host or component.
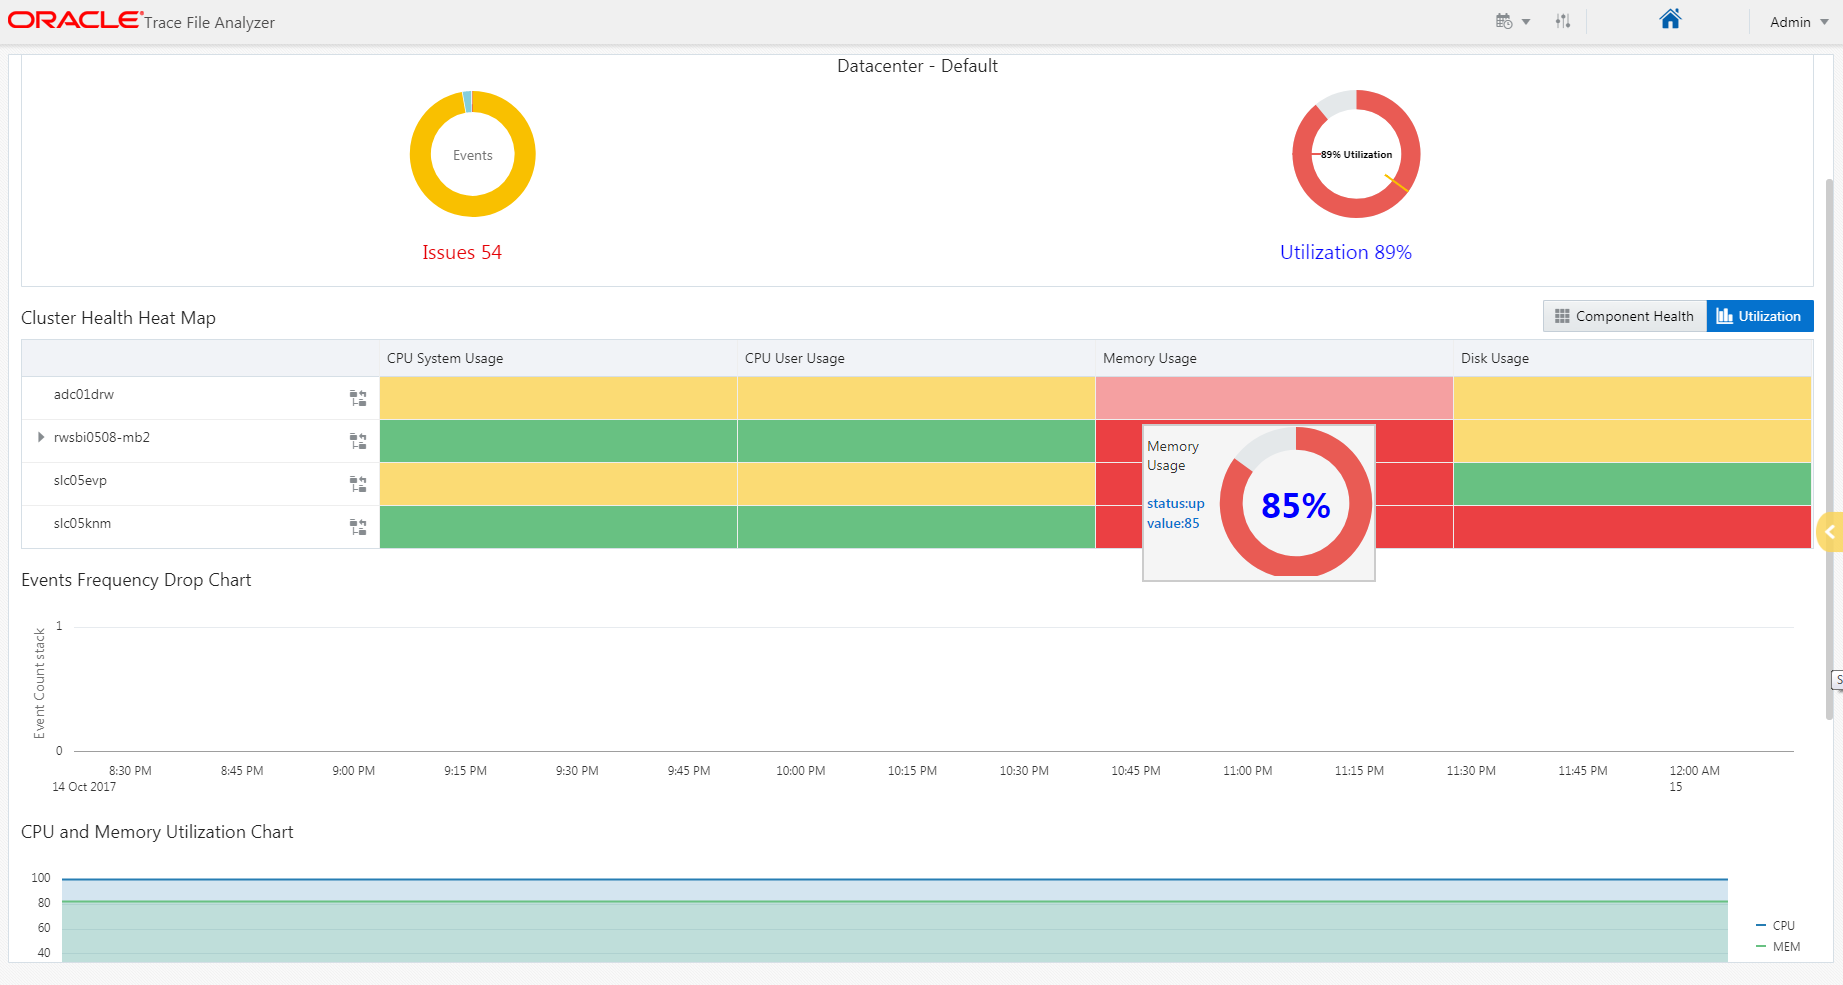
Clicking on Utilization shows system utilization broken down by:
-
CPU system usage
-
CPU user usage
-
Memory usage
-
Disk usage
Hovering on a section of the heatmap shows more information.
20.3 Detailed View
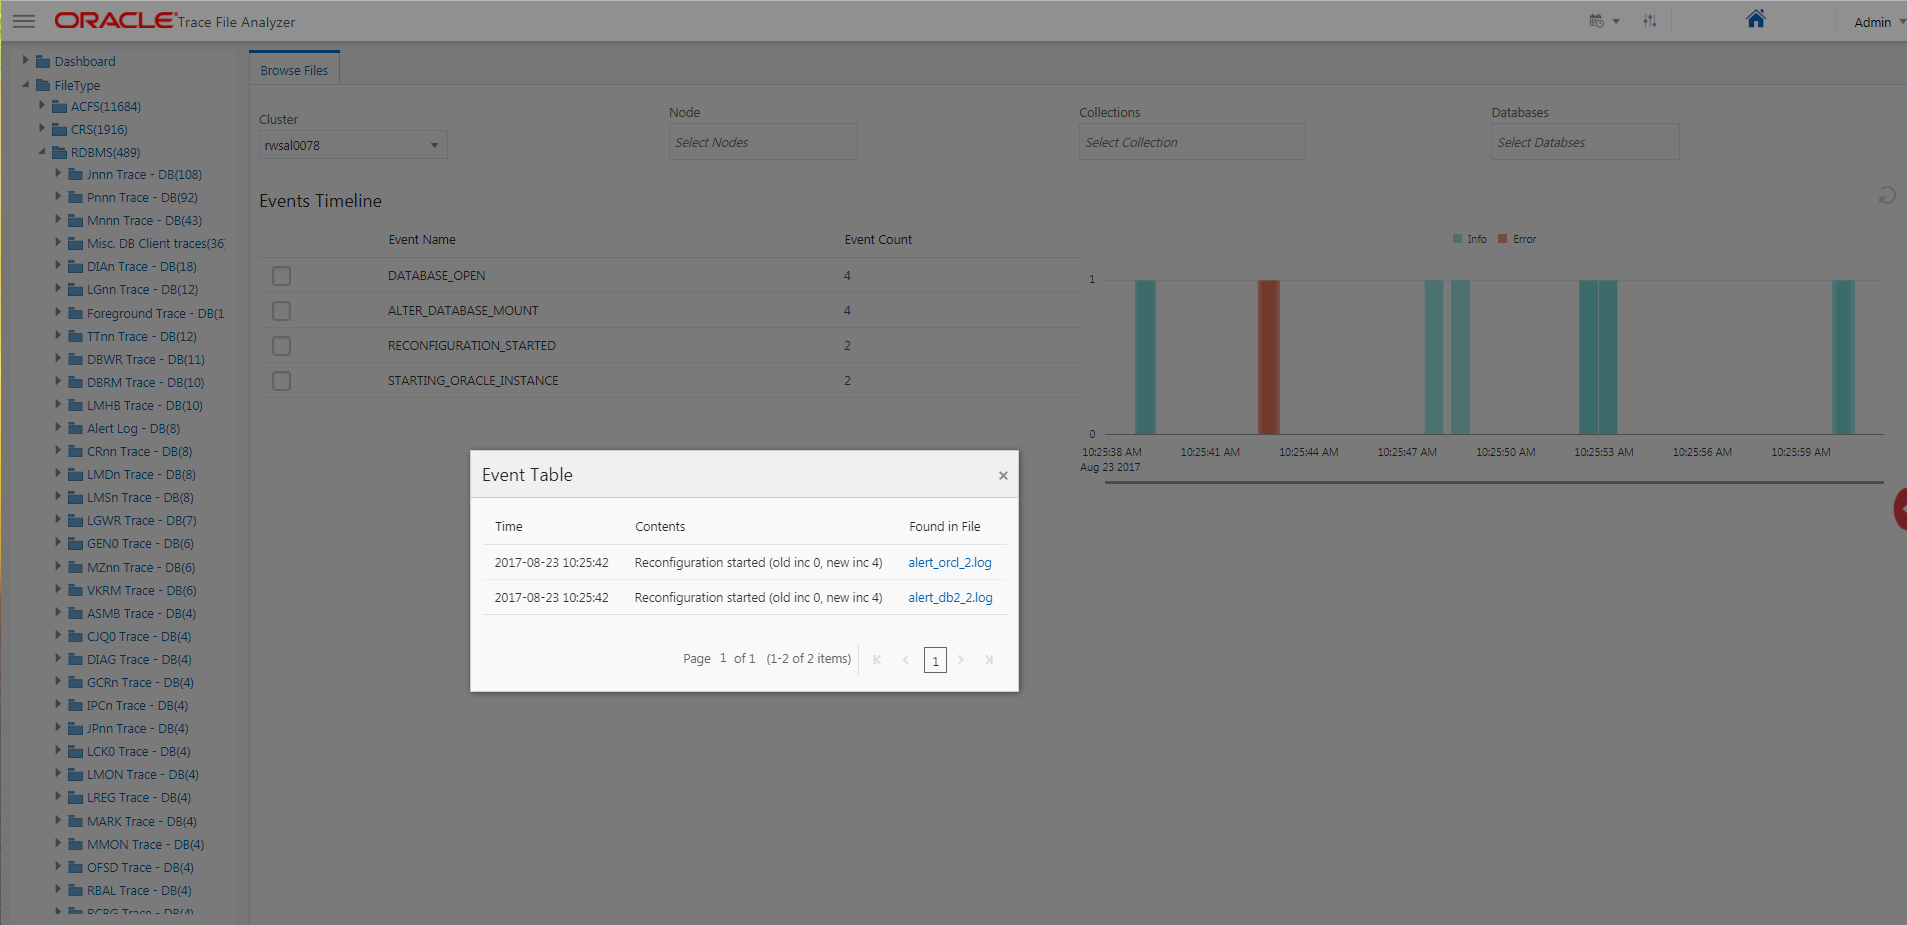
Detailed view displays a dashboard with top events represented in a timeline.
Click any event to view a short analysis including:
-
Files where event is seen
-
Events around the time
-
CPU and memory usage around the time
Click a file to open:
-
Browse files by file type, folder, collection
-
View files
-
Merge multiple files
20.4 File Browser
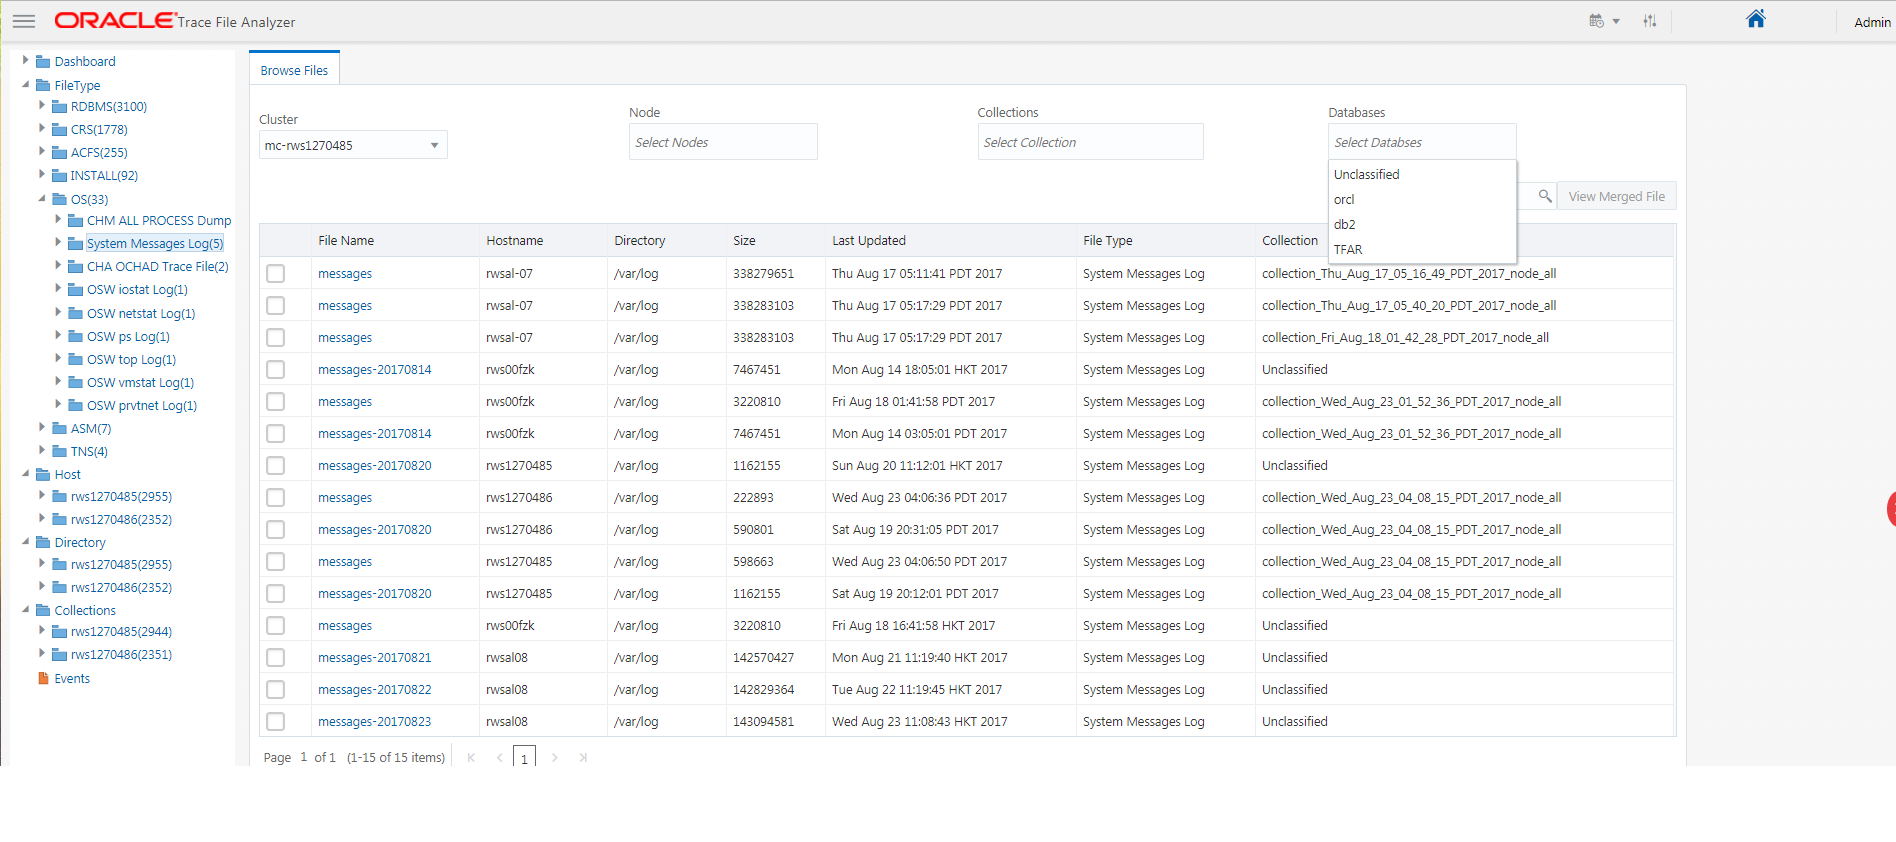
Oracle Trace File Analyzer Service classifies each trace file and provides an interface to browse files by various classifications.
Classifications make it easy to find important files across thousands of trace files generated by various components.
The interface shows a tree navigation menu on left to browse files by type, host name, actual directory, or by Oracle Trace File Analyzer collections. You can also filter the file list by cluster, node, or Oracle Trace File Analyzer collection. There is a search option to find file names by keyword search.
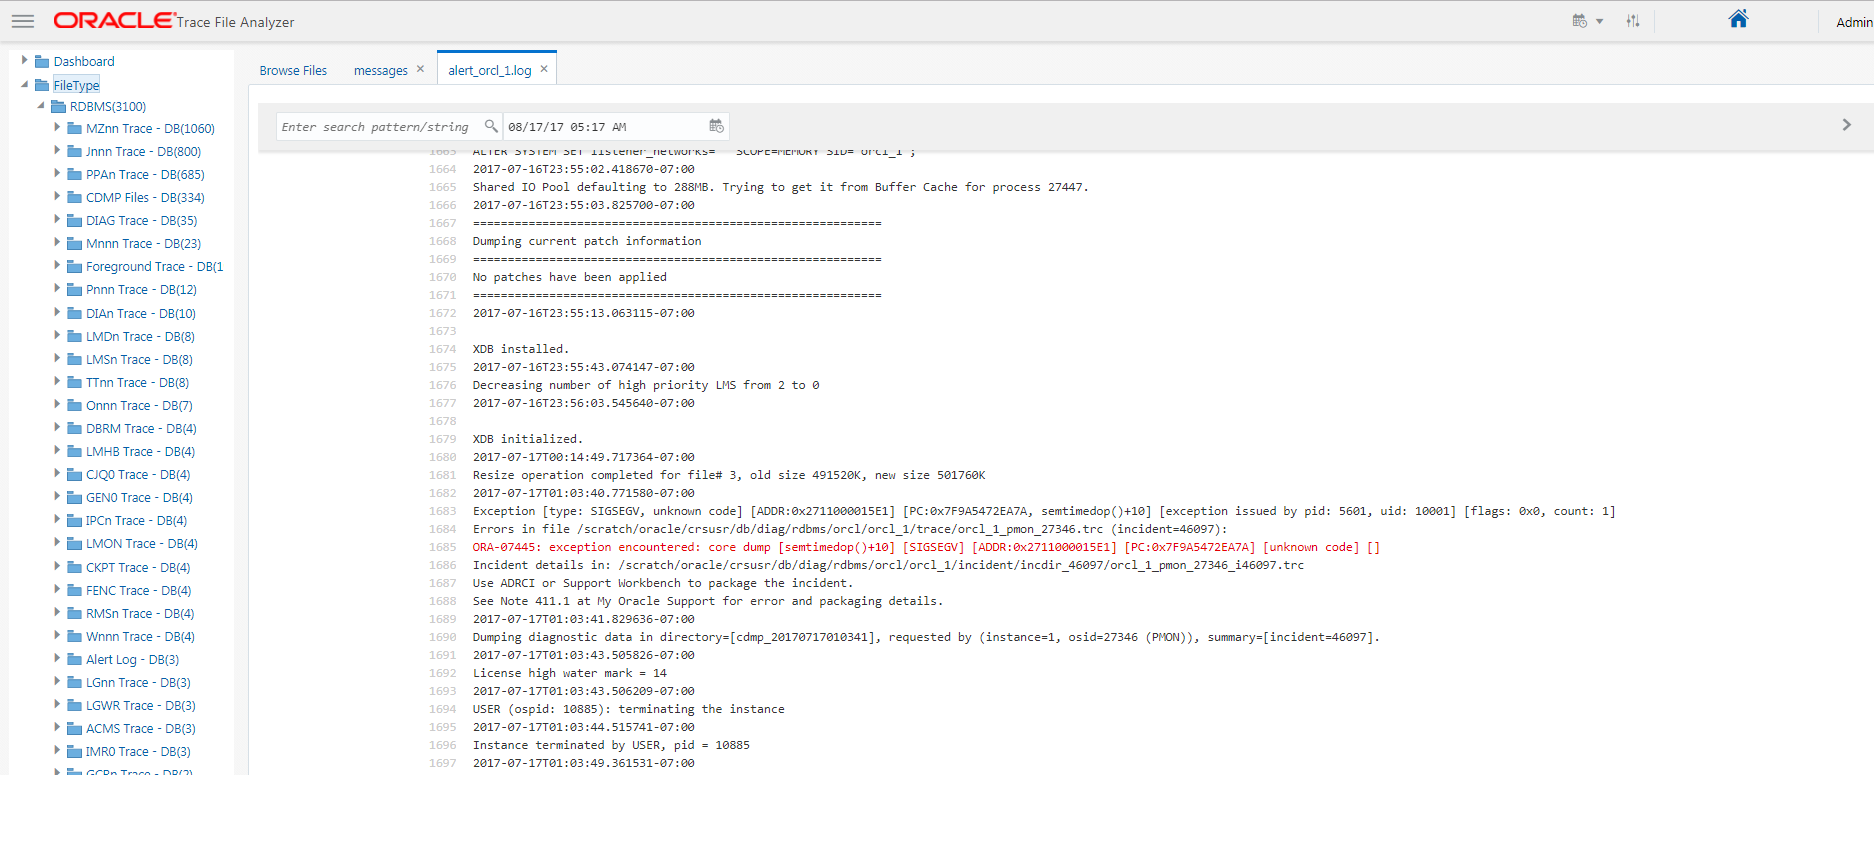
Use the tree on the left to click browse files by file type, folder, and collection.
Click a file to open it or merge multiple files to view combined events across multiple files.
20.5 File Viewer
File viewer opens each file in a new tab.
You can move back and forth during the analysis of a problem without losing the context.
Within a file, file viewer highlights important lines to identify the critical lines instantly. You can also search within a file and jump to a specific section.
20.6 Merged Files
To find what’s happening in different components at the same time, look at multiple trace files.
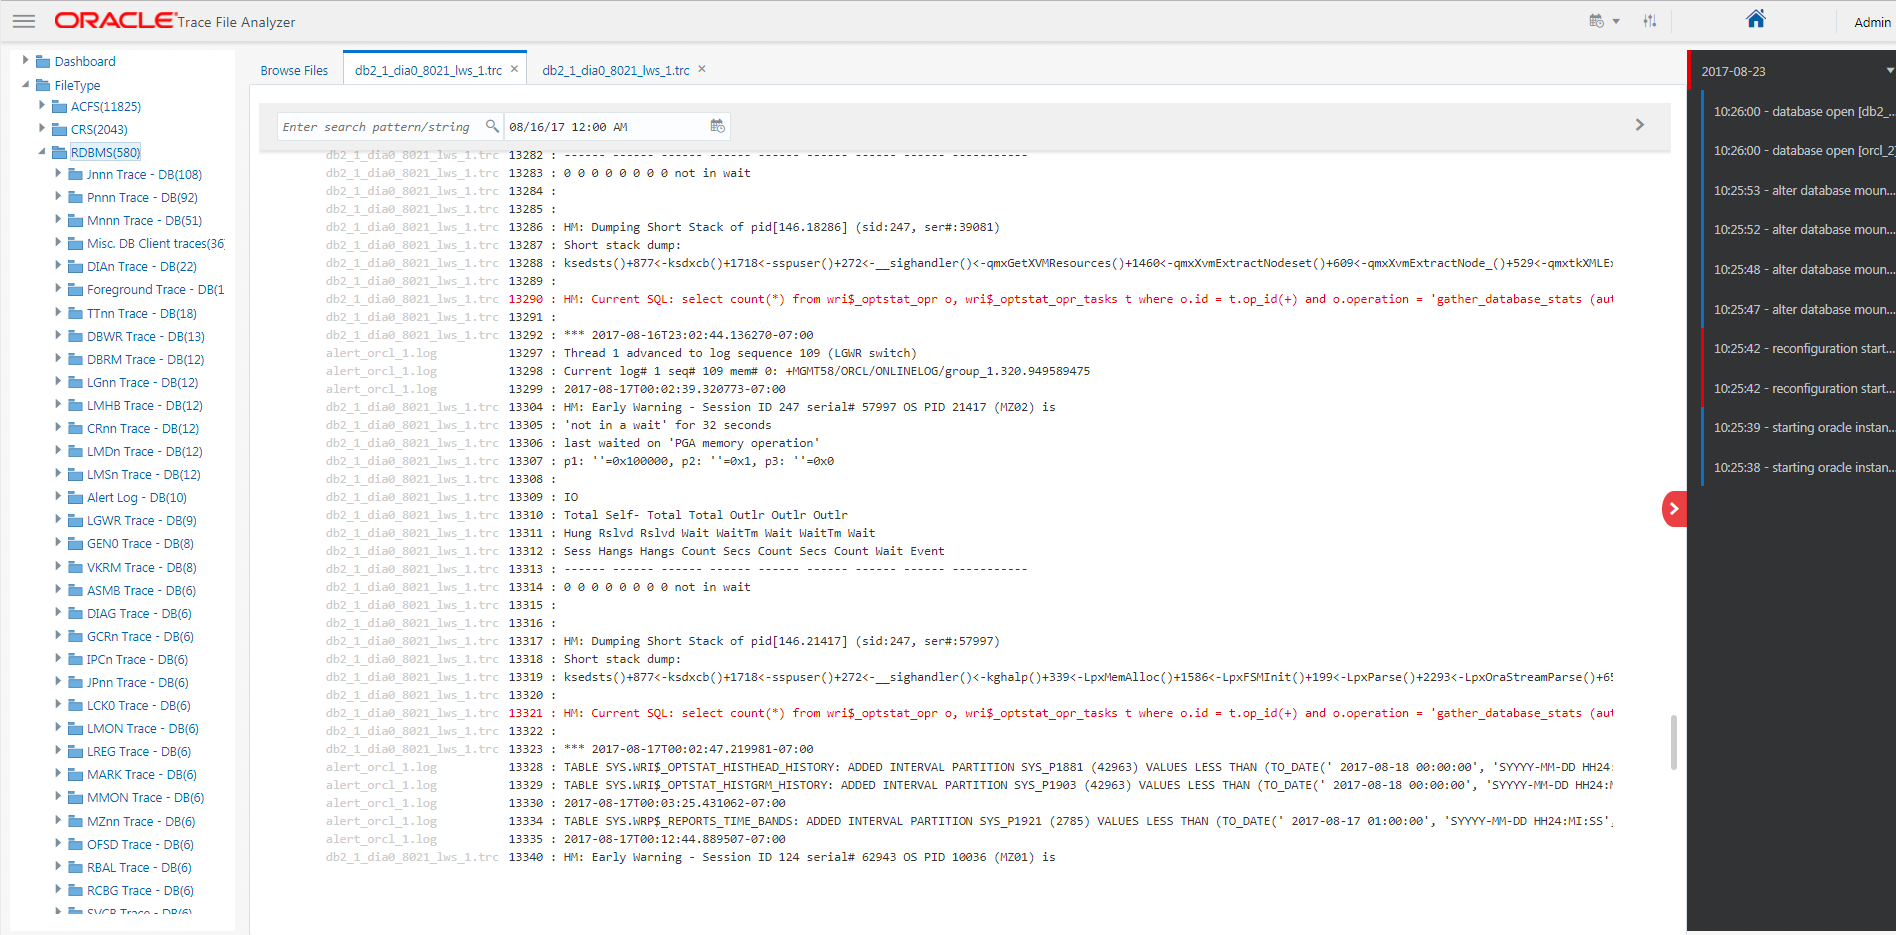
The merge feature combines multiple timeline trace files by time and provides a single view.
This sample output shows a database alert log combined with system messages file.
20.7 Importing CA Certificates into Tomcat
Oracle Trace File Analyzer service starts an Apache Tomcat instance to serve web requests.
-
Tomcat is set up at
$TFA_HOME/tomcat. -
Tomcat configuration file:
$TFA_HOME/tomcat/conf/server.xml.
Note:
For detailed instructions to set up SSL, refer to the official Tomcat documentation:
To import CA Certificates into Tomcat:
