Monitoring an Oracle Globally Distributed Database
Oracle Globally Distributed Database can be monitored using Enterprise Manager Cloud Control or GDSCTL.
Querying System Objects Across Shards
Use the SHARDS() clause to query Oracle-supplied tables to gather performance, diagnostic, and audit data from V$ views and DBA_* views.
The shard catalog database can be used as the entry point for centralized diagnostic operations using the SQL SHARDS() clause. The SHARDS() clause allows you to query the same Oracle supplied objects, such as V$, DBA/USER/ALL views and dictionary objects and tables, on all of the shards and return the aggregated results.
As shown in the examples below, an object in the FROM part of the
SELECT statement is wrapped in the SHARDS() clause to
specify that this is not a query to local object, but to objects on all shards in the
sharded database configuration. A virtual column called SHARD_ID is
automatically added to a SHARDS()-wrapped object while processing a
multi-shard query to indicate the source of every row in the result. The same column can be
used in predicate for pruning the query.
A query with the SHARDS() clause can only be run on the shard catalog database.
Examples
The following statement queries performance views
SQL> SELECT shard_id, callspersec FROM SHARDS(v$servicemetric)
 WHERE service_name LIKE 'oltp%' AND group_id = 10;
The following statement gathers statistics.
SQL> SELECT table_name, partition_name, blocks, num_rows
 FROM SHARDS(dba_tab_partition) p
 WHERE p.table_owner= :1;
The following example statement shows how to find the SHARD_ID value for each shard.
SQL> select ORA_SHARD_ID, INSTANCE_NAME from SHARDS(sys.v_$instance);

    ORA_SHARD_ID INSTANCE_NAME
    ------------ ----------------
               1 sh1
              11 sh2
              21 sh3
              31 sh4
The following example statement shows how to use the SHARD_ID to prune a query.
SQL> select ORA_SHARD_ID, INSTANCE_NAME
 from SHARDS(sys.v_$instance)
 where ORA_SHARD_ID=21;

    ORA_SHARD_ID INSTANCE_NAME
    ------------ ----------------
              21 sh3
See Also:
Oracle Database SQL
Language Reference for more information about the SHARDS() clause.
Monitoring an Oracle Globally Distributed Database with Enterprise Manager Cloud Control
Oracle Globally Distributed Database targets are found in the All Targets page in Enterprise Manager Cloud Control.
To monitor Oracle Globally Distributed Database components you must first enable statistics gathering and then discover the Oracle Globally Distributed Database. See Prerequisite: Enable Sharded Database Metrics and Prerequisite: Discover the Oracle Globally Distributed Database Topology for more information.
Sharded Database Home Page
The target home page for a sharded database shows you a summary of the sharded database configuration and status.
Summary
The Summary pane, in the top left of the page, shows the following information:
-
Sharded Database Name: Sharded database name
-
Sharded Database Domain Name: Sharded database domain name
-
Catalog Database: Shard catalog database name. You can click the name to view more information about the shard catalog database.
-
Catalog Version: Oracle Database version of the shard catalog
-
Sharding Type: Sharding method used to shard the database. This could be System-managed, User-defined, or Composite.
-
Replication Type: Replication technology used for high availability. This could be Data Guard or Raft.
-
Shard Directors: Number and status of the shard directors
-
Master Shard Director: Primary shard director name. You can click the shard director name to view more information about the primary shard director, including the shard director (global service manager) version, current status, ports used, and incidents.
-
Replication Factor: If Replication Type is Raft, the replication factor (number of members in a replication unit) configured for Raft replication type is displayed.
-
Replication Units: If Replication Type is Raft, the number of replication units in the sharded database for Raft replication type is displayed.
Members
The Members pane, in the upper right of the page, shows some relevant information about each of the sharded database components.
The pane is divided into tabs for each component: Shardspaces, Shardgroups, Shard Directors, Shards, Catalog Databases, and Global Services. Click on a tab to view the information about each type of component
-
Shardspaces:
Shardspaces are only displayed for databases sharded with the user-defined or composite sharding method.
The Shardspaces tab displays the shardspace names, status, number of chunks, and Data Guard protection mode if Data Guard is configured. The shardspace names can be clicked to reveal more details about the selected shardspace.
You can click the shardspace name to view more details, including information about the shardgroups within the shardspace (for composite sharding) and incidents.
-
Shardgroups:
Shardgroups are only displayed for databases sharded with the system-managed or composite sharding method.
The Shardgroups tab displays the shardgroup names, status, and the shardspace to which it belongs, the region to which it belongs, and if Replication Type is Data Guard the Data Guard Role is shown.
You can click the shardgroup name to reveal more details about the selected component, including information about the shards within the shardgroup, and incidents.
Note that for a database sharded using the system-managed sharding method,
shardspaceorais the shardspace created by default to contain all of the shardgroups. It is managed by the sharded database and will not appear in the Shardspaces tab. -
Shard Directors:
The Shard Directors tab displays the shard director names, status, region, host, and Oracle home.
You can click the shard director names to reveal more details about the selected shard director, including the shard director (global service manager) version, current status, ports used, and incidents.
You can also click the shard director host to view more details about the host system.
-
Shards:
The Shards tab displays the shard names, Data Guard roles (if applicable), target type, target status, the shardspaces and shardgroups to which they belong, the regions to which they belong, and the state.
In the Names column, you can expand the primary shards to display the information about their corresponding standby shards.
You can hover the mouse over the Deployed column icon and the deployment status details are displayed. You can click on the shard, shardspace, and shardgroup names to reveal more details about the selected component.
-
Catalog Databases
The Catalog Databases tab lists the shard catalog databases and displays the shard catalog database name, type, status, and role for each catalog database.
You can click on the catalog database name to view more information about the database.
-
Global Services:
The Global Services tab displays the name, status, and Data Guard role of the sharded database global services. Above the list is shown the total number of services and an icon showing how many services are in a particular status. You can hover your mouse pointer over the icon to read a description of the status icon.
Incidents
The Incidents pane displays messages and warnings about the various components in the sharded database environment. More information about how to use this pane is in the Cloud Control online help.
Sharded Database Menu
The Sharded Database menu, located in the top left corner, provides you with access to tools to manage the sharded database components.
Target Navigation
The Target Navigation pane gives you easy access to more details about any of the components in the sharded database.
Clicking the navigation tree icon on the upper left corner of the Sharded Database home page opens the Target Navigation pane. This pane shows all of the discovered components in the sharded database in tree form.
Expanding a shardspace reveals the shardgroups in them. Expanding a shardgroup reveals the shards in that shardgroup.
Any of the component names can be clicked to view more details about them.
Data Distribution and Performance Page
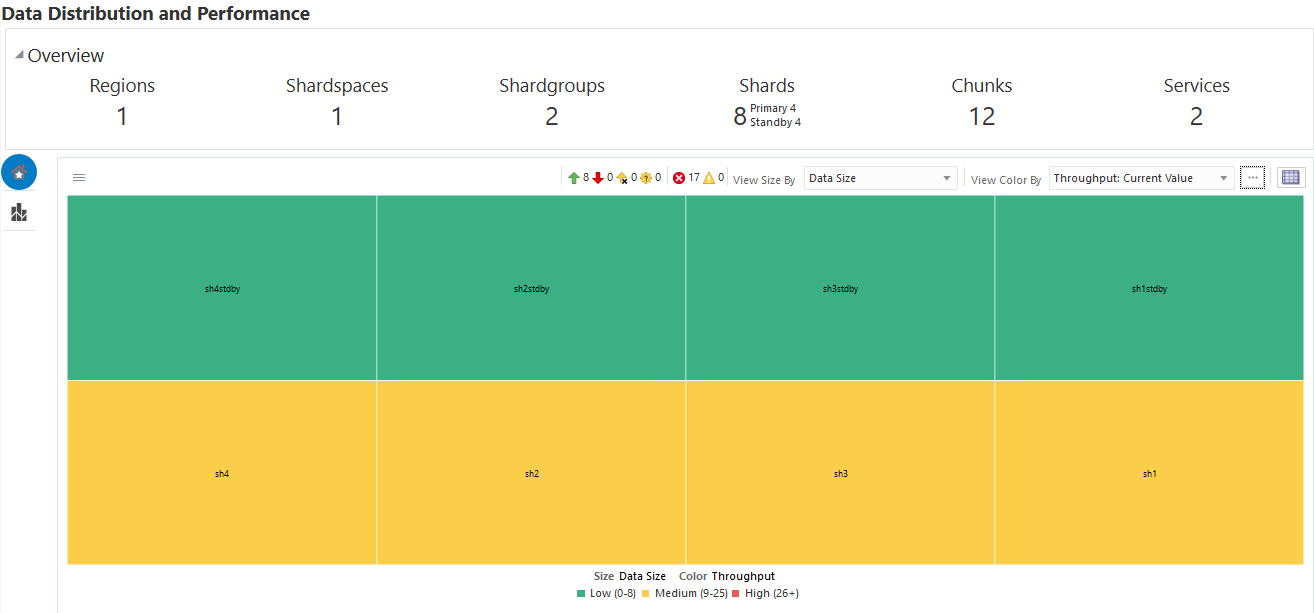
In Enterprise Manager Cloud Control, the Sharded Database page, Data Distribution and Performance, gives you an overall view of the data in your sharded database and how the shards are performing.
Overview

The Overview section at the top of the page displays number of regions, shardspaces, shardgroups, shards (broken down into primary and standby), chunks, and services in the sharded database configuration that are represented by the data in the chart. If you apply a filter to the chart these numbers change.
Data Distribution and Performance Chart Views
The two icons at the top left corner of the chart toggle the chart between two views:
Figure 10-1 Home and Top Shards Icons
-
Home: is the default view. Home displays data for all shards in the sharded database by default. You can filter the chart and change the metrics on display as described below.
-
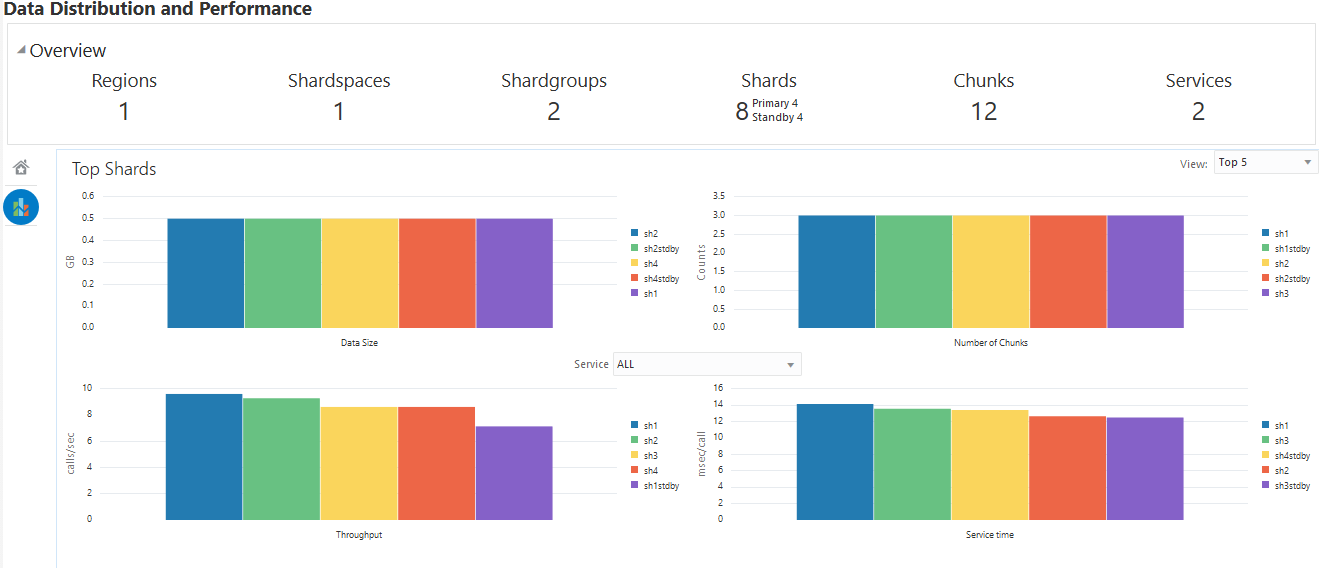
Top Shards: shows you charts for the top 5, 10, or 20 shards for certain metrics.
Shard Blocks
The color-coded chart displays data by shard. Each shard is indicated by a block.
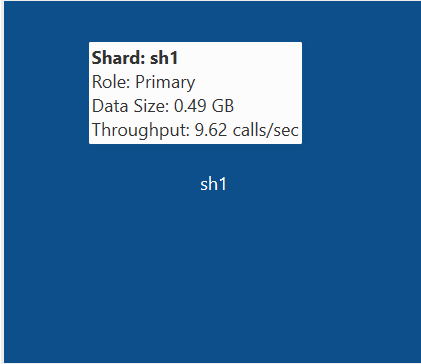
Figure 10-2 Shard Block with Mouse Over Text

Each block is labeled with the shard name. Moving the mouse over a block displays the Shard name, Data Guard Role, Number of Chunks in the shard, and the Service Time (msec/call).
Note:
If you are using default database metrics then you will not see data from any undiscovered shards in the chart.If you are using enhanced metrics, the data for all shards is displayed because the shards are discovered by the shard catalog.
Home View Summary Icons
The row of icons above the chart display the following information:
Figure 10-3 Home View Summary Icons
-
Up: (Green arrow pointing up) Number of shard databases that are up
-
Down: (Red arrow pointing down) Number of shards that are down
-
Unmonitored: (Yellow arrow with "X") Number of shards that are unmonitored. This is the number of shards not discovered by Enterprise Manager.
-
Other: (Yellow gear with question mark "?")Sharded database targets discovered in Enterprise Manager, but that have some issue with target monitoring, such as an unreachable agent, or an availability evaluation error.
-
Critical: (Red circle with "X") Number of critical incidents
-
Warning: (Yellow triangle with exclamation point "!") Number of warning incidents
Chart View Controls
Compare metrics on each of the shards by size and color of the blocks in the chart.
Figure 10-4 Chart View Controls

-
View Size By: changes the size distribution of the blocks by the metric selected
-
View Color By: changes the comparative color of the blocks by the metric selected
By default, the colors are light, medium, and dark blue, which indicates that the thresholds for the lightest and darkest color categories are set to arbitrary Enterprise Manager defaults.
Click Configure Threshold (button with three dots) to set custom thresholds for low and high categories in each metric. Charts configured with custom thresholds are shown in a different color spectrum with green=low, yellow=medium, and red=high.
-
Tree Map Table View: (button with table at the top right corner of the chart) displays a table view of the data shown in the chart
Filters
Click the hamburger icon at the top left corner of the chart to apply filters to the data.
Figure 10-5 Filters Icon
-
Shard Search: Filter by shard name. You can use an asterisk (*) to select a group of shards with matching name patterns.
-
Key Search: Lets you enter a shard key value to view the shards that contain data with that key. In the resulting chart you can right-click a block and select Shard-Level Data Distribution to drill down into a particular shard.
-
SQL ID Search: Display which shards are processing a query by the SQL ID for the query, which you can find in the
V$SQL_SHARDview in the catalog database. -
Sort By: Sort the blocks in the chart by size in the default tiled view, in a sequence of bars, or show only the top or bottom 5 blocks.
-
Filter By: Lets you display only shards in the specified Role, Shardgroup, or Service.
Hide Inactive Shards: When using the Service filter, you will see all of the shards; however, shards on which the service is not running are shown in grey (inactive), and you can use the checkbox to hide the inactive shards.

-
Group By: Toggles that display aggregates for the group, which is indicated by a box line around the group of shards.
-
Shardgroup displays a shardgroup box at the top of the grouping, which displays aggregate info about the shardgroup on hover, and you can drill down for shardgroup-based data.
-
Region displays a region box at the top of the group, which displays aggregate info about the region on hover.
-
Data Guard Aggregate Group groups each shard and its standbys as a single entity, so that you can see the data set being handled by a particular shard and its standbys as a whole.
-
Top Shards View
Click the Top Shards button on the left side of the chart to view graphs with metrics on the shards with the highest Data Size, Number of Chunks, Throughput, and Service Time.

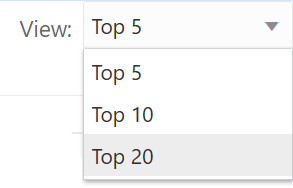
Use the View list at the top right corner of the view to display the top 5, 10, or 20 shards in each graph.

Monitoring Oracle Globally Distributed Database with GDSCTL
There are numerous GDSCTL CONFIG commands that you can use to obtain the health status of individual shards, shardgroups, shardspaces, and shard directors.
Monitoring a shard is just like monitoring a normal database, and standard Oracle best practices should be used to monitor the individual health of a single shard. However, it is also important to monitor the overall health of the entire sharded environment. The GDSCTL commands can also be scripted and through the use of a scheduler and can be done at regular intervals to help ensure that everything is running smoothly.
See Also:
Oracle Database Global
Data Services Concepts and Administration
Guide for information about using the GDSCTL CONFIG commands