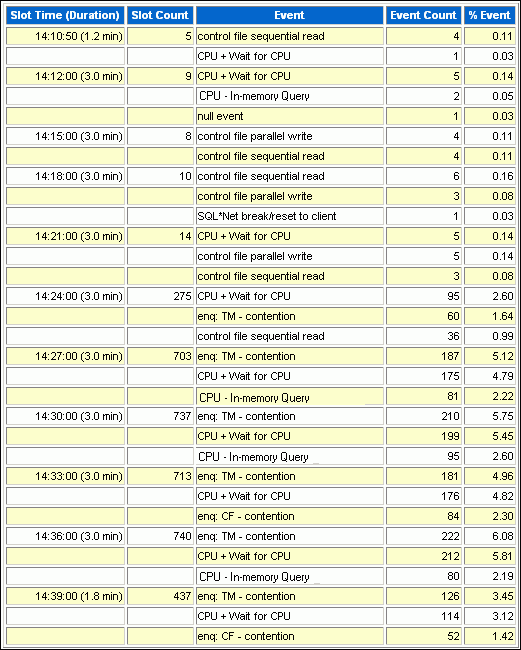
Activity Over Time
The Activity Over Time section of the ASH report is particularly useful for longer time periods because it provides in-depth details about activities and workload profiles during the analysis period. The Activity Over Time section is divided into time slots. The ASH report time span is divided into 10 time slots unless the time period is short or the data is sparse.
Figure 8-8 shows an activity report for the period between 2:10 p.m. and 2:40 p.m. The report indicates that the number of sampled sessions rose sharply in the sixth inner slot (2:24 p.m.) and stayed up. During this period CPU activity and lock enqueue waits increased dramatically.
Each time slot contains session and wait event activity, as described in Table 8-1.
Table 8-1 Activity Over Time
| Column | Description |
|---|---|
|
Slot Time (Duration) |
Duration of the slot |
|
Slot Count |
Number of sampled sessions in the slot |
|
Event |
Top three wait events in the slot |
|
Event Count |
Number of ASH samples waiting for the wait event |
|
% Event |
Percentage of ASH samples waiting for wait events in the entire analysis period |
All inner slots are the same number of minutes each for easy comparison. The first and last slots, called outer slots, are odd-sized because they do not have a fixed slot time.
When comparing the inner slots, perform a skew analysis by identifying spikes. A spike in the Slot Count column indicates an increase in active sessions and a relative increase in database workload. A spike in the Event Count column indicates an increase in the number of sampled sessions waiting for an event. Typically, when the number of active session samples and the number of sessions associated with a wait event increase, the slot may be the cause of the transient performance problem.
