Identifying High-Load SQL Statements Using Top SQL
ADDM automatically identifies high-load SQL statements that may be causing system-wide performance degradation. Under normal circumstances, manual identification of high-load SQL statements is not necessary. In some cases, however, you may want to monitor SQL statements at a more granular level.
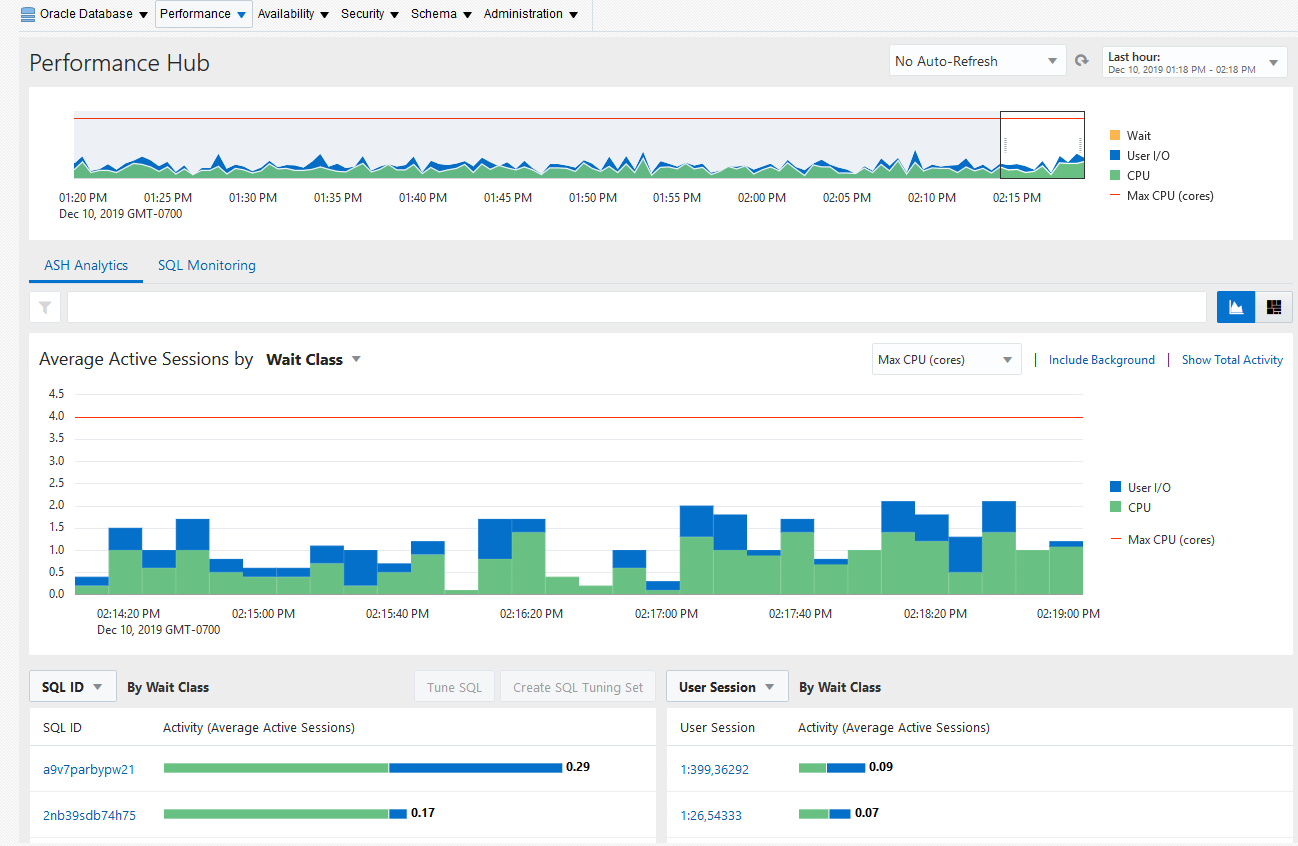
The Top SQL section of the Top Activity page in Cloud Control enables you to identify high-load SQL statements for any 5-minute interval.
Figure 11-1 shows an example of the Top Activity page. The page shows a 1-hour time line of the top activity running on the database. SQL statements that are using the highest percentage of database activity are listed under the Top SQL section, and are displayed in 5-minute intervals.
To access the SQL Monitoring:
-
From the Targets drop-down menu, select Databases.
See "Accessing the Database Home Page" for more information.
-
From the Performance drop-down menu, select Performance Hub and ASH Analytics.
-
Using the drop-down menu on the right of Average Active Sessions by, select SQL and one of its fly-out options.
- SQL ID
- Top Level SQL ID
- SQL Force Matching Signature
- SQL Plan Hash Value
- SQL Full Plan Hash Value
- SQL Plan Operation
- SQL Plan Operation Line
- SQL Opcode
- Top Level SQL Opcode
-
To move the 5-minute interval, drag the shaded box to the desired time.
The information contained in the Top SQL section is automatically updated to reflect the selected time period.
