Monitoring Parallel Execution
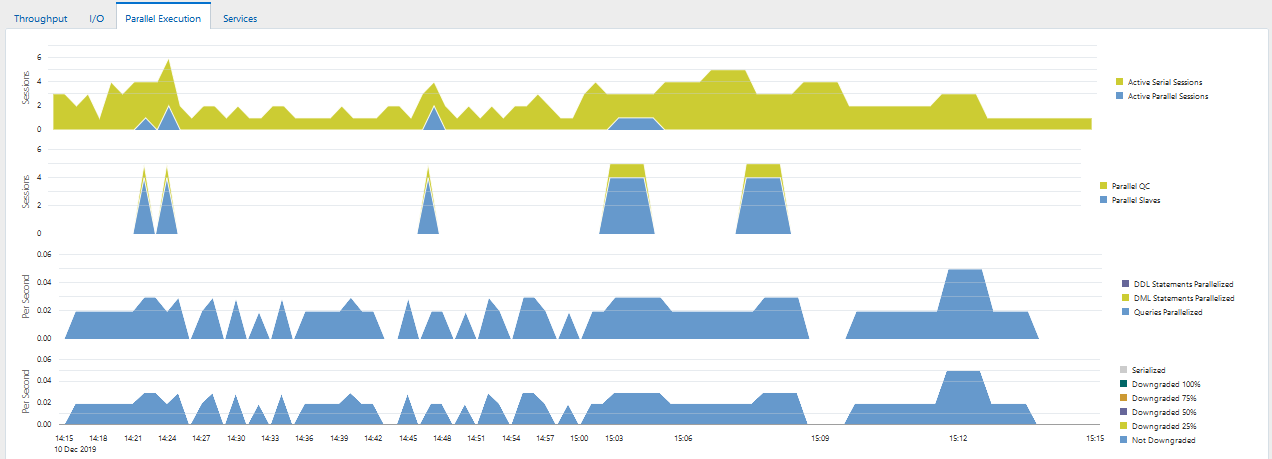
The Parallel Execution charts show system metrics related to parallel queries. Metrics are statistical counts per unit. The unit could be a time measure, such as seconds, or per transaction, or session.
A parallel query divides the work of executing a SQL statement across multiple processes. The charts show parallel queries that were waiting for a particular wait event that accounted for the highest percentages of sampled session activity.
To monitor parallel execution:
-
Access the Database Home page.
See "Accessing the Database Home Page" for more information.
-
From the Performance menu, select Performance Home.
If the Database Login page appears, then log in as a user with administrator privileges. The Performance page appears.
-
In the instance activity chart, click Parallel Execution tab.
The Parallel Execution charts appear.
Two pairs of charts are shown. The first pair shows the number of sessions on the y-axis, whereas the second pair shows the per second rate on the y-axis.
