Top User Events
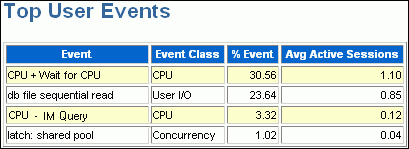
The Top User Events subsection of the report lists the top wait events from client processes that accounted for the highest percentages of sampled session activity.
Figure 8-1 shows that most database activity is consumed by the CPU + Wait for CPU event. The Wait for CPU is the time the process spent in the operating system run queue. The %Event column shows the percentage of DB time consumed by this event. In this example, over 30 percent of DB time was spent either on the CPU or waiting to get on it. The Load Profile section should be examined next to determine the type of activity that is causing this CPU consumption.
