Styles
A style is a visual attribute that can be used to represent a spatial feature.
The basic map symbols and labels for representing point, line, and area features are defined and stored as individual styles. Each style has a unique name and defines one or more graphical elements in an XML syntax.
Each style is of one of the following types:
-
Color: a color for the fill or the stroke (border), or both.
-
Marker: a shape with a specified fill and stroke color, or an image. Markers are often icons for representing point features, such as airports, ski resorts, and historical attractions.
When a marker style is specified for a line feature, the rendering engine selects a suitable point on the line and applies the marker style (for example, a shield marker for a U.S. interstate highway) to that point.
-
Line: a line style (width, color, end style, join style) and optionally a center line, edges, and hash mark. Lines are often used for linear features such as highways, rivers, pipelines, and electrical transmission lines. You can also use cased line styles, which are useful for drawing streets and highways.
-
Area: a color or texture, and optionally a stroke color. Areas are often used for polygonal features such as counties and census tracts.
-
Text: a font specification (size and family) and optionally highlighting (bold, italic) and a foreground color. Text is often used for annotation and labeling (such as names of cities and rivers).
-
Advanced: a composite used primarily for thematic mapping, which is described in Thematic Mapping. The key advanced style is
BucketStyle, which defines the relationship between a set of simple rendering (and optionally labeling) styles and a set of buckets. For each feature to be plotted, a designated value or set of values from that feature is used to determine which bucket the feature falls into, and then the style associated with that bucket is used to plot the feature. Bucket styles are described in Bucket Styles.Two special types of bucket styles are also provided: color scheme (described in Color Scheme Styles) and variable (graduated) marker (described in Variable Marker Styles). Other advanced styles are dot density (described in Dot Density Marker Styles), bar chart (described in Bar Chart Marker Styles), collection (described in Collection Styles), variable pie chart (described in Variable Pie Chart Styles), and heat map (described in Heat Map Styles).
Table: Style Types and Applicable Geometry Types lists the applicable geometry types for each type of style.
Table: Style Types and Applicable Geometry Types
| Style Type | Applicable Geometry Types |
|---|---|
| Color | (any type) |
| Marker | point, line |
| Line | line |
| Area | polygon |
| Text | (any type) |
| Advanced | (any type) |
All styles for a database user are stored in that user’s USER_SDO_STYLES view, which is described in Map Visualization Component Metadata Views and xxx_SDO_STYLES Views.
You can also create dynamically defined styles (that is, temporary styles) of any style type as part of a map request. To create them, use the Oracle Maps JavaScript API, using classes and methods to create all types of styles dynamically.
What you are actually creating is the XML definition of the styles; it is the map visualization component server that actually creates such dynamically defined styles from the definitions when it processes the map request, and it discards the dynamically created styles when the request is completed.
Scaling the Size of a Style (Scalable Styles)
If you specify a unit other than the default of pixels (px) in a style definition, the style becomes scalable: that is, the size of features associated with the style is scaled as users zoom in or out on a map. For example, if you specify a marker style’s width and height as 100m, the marker is displayed as a square 100 meters on each side according to the map scale at the current zoom level.
The following are style types and the attributes that can have an associated size unit:
-
Marker styles: marker size (height and width) and text attributes (font size, label offsets)
-
Line styles: overall line width, center line width and dash pattern, wing line width and dash pattern, hash mark, and marker pattern (size, offset, interval)
-
Text styles: font size, halo width
-
Bar chart styles: bar width and height
-
Dot density styles: dot width and height
-
Pie chart styles: pit radius
Example: Scalable Marker Style
Example: Scalable Marker Style defines a star-shaped marker within a bounding box 15 kilometers (15.0km) on each size. This definition might be useful for identifying capital cities of states on a map showing all or a large part of a country; however, it would not be useful for a display zoomed in on a specific city and its local surrounding area.
<style name="M.STAR_CAPITAL_CITY">
  <svg width="1in" height="1in">
    <desc/>
    <g class="marker" style="stroke:#000000;fill:#FF0000;fill-opacity:0;width:15.0km;height:15.0km;font-family:Dialog;font-size:12;font-fill:#FF0000">
        <polyline points="138.0,123.0,161.0,198.0,100.0,152.0,38.0,198.0,61.0,123.0,0.0,76.0,76.0,76.0,100.0,0.0,123.0,76.0,199.0,76.0"/>
    </g>
  </svg>
</style>
Example: Scalable Line Style
Example: Scalable Line Style defines a line style with an overall line width of 10 meters (10.0m) and a border line width of 1 meter (1.0m). This definition might be useful for identifying capital cities of primary highways.
<style name="L.PRIMARY_HIGHWAY">
  <svg width="1in" height="1in">
    <desc></desc>
    <g class="line" cased="true" style="fill:#33a9ff;stroke-width:10.0m">
      <line class="parallel" style="fill:#aa55cc;stroke-width:1.0m"/>
    </g>
  </svg>
</style>
When the map visualization component renders or labels styles that have size units other than pixel, it first transforms the size units into screen pixels based on the current map area and display area, and it then renders the or labels the style. The size of a scalable style changes as users zoom in or out on a map. If zooming out results in an overall style size less than or equal to zero, the style is not rendered or labeled.
Size units can be used only with data associated with a known spatial reference system (SRS). If the data has no SRS or an unknown SRS, pixels are used for all size values. Note also that pixel values are used instead of any specified size unit in legends and in previews rendered by the Map Builder utility. (Legends are explained in Map Legend.)
Specifying a Label Style for a Bucket
For collection-based bucket styles and individual range-based bucket styles (described in Bucket Styles and Color Scheme Styles, respectively), you can specify a labeling style by using the label_style attribute in each bucket element. Example: Advanced Style with Text Label Style for Each Bucket creates an advanced style named V.COUNTY_POP_DENSITY in which each bucket is assigned a text label style (using the label_style attribute), with some styles being used for several buckets.
Example: Advanced Style with Text Label Style for Each Bucket
<?xml version="1.0" ?>
<AdvancedStyle>
     <BucketStyle>
        <Buckets>
            <RangedBucket seq="0" label="<150k"
              low="-Infinity" high="150000"
              style="C.CB_QUAL_8_CLASS_DARK2_1"
              label_style="T.BLUE_SERIF_12"/>
            <RangedBucket seq="1" label="150k - 350k"
              low="150000" high="350000"
              style="C.CB_QUAL_8_CLASS_DARK2_2"
              label_style="T.BLUE_SERIF_12"/>
            <RangedBucket seq="2" label="350k - 600k"
              low="350000" high="600000"
              style="C.CB_QUAL_8_CLASS_DARK2_3"
              label_style="T.BROWN_SERIF_12"/>
            <RangedBucket seq="3" label="600k - 1000k"
              low="600000" high="1000000"
              style="C.CB_QUAL_8_CLASS_DARK2_4"
              label_style="T.BROWN_SERIF_12"/>
            <RangedBucket seq="4" label="1000k - 1500k"
              low="1000000" high="1500000"
              style="C.CB_QUAL_8_CLASS_DARK2_5"
              label_style="T.GREY_SERIF_12"/>
            <RangedBucket seq="5" label="1500k - 2500k"
              low="1500000" high="2500000"
              style="C.CB_QUAL_8_CLASS_DARK2_6"
              label_style="T.GREY_SERIF_12"/>
            <RangedBucket seq="6" label="2500k - 5000k"
              low="2500000" high="5000000"
              style="C.CB_QUAL_8_CLASS_DARK2_7"
              label_style="T.GREEN_SERIF_12"/>
            <RangedBucket seq="7" label=">=5000k"
              low="5000000" high="Infinity"
              style="C.CB_QUAL_8_CLASS_DARK2_8"
              label_style="T.GREEN_SERIF_12"/>
    </Buckets>
   </BucketStyle>
</AdvancedStyle>
For individual range-based buckets, the lower-bound value is inclusive, while the upper-bound value is exclusive (except for the range that has values greater than any value in the other ranges; its upper-bound value is inclusive). No range is allowed to have a range of values that overlaps values in other ranges.
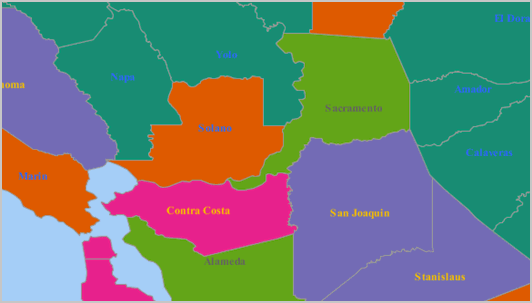
If the V.COUNTY_POP_DENSITY style in Example: Advanced Style with Text Label Style for Each Bucket is used in a map request, it displays a map that might look like the display in Figure: Varying Label Styles for Different Buckets, where the county names are shown with labels that reflect various text styles (in this case depending on the county’s total population).
Figure: Varying Label Styles for Different Buckets
Description of the illustration thematic_map_display.gif
In Example: Advanced Style with Text Label Style for Each Bucket, all buckets except the last one specify a label style. For any features that fall into a bucket that has no specified label style, the label style (if any) applied to the feature depends on the following:
-
If the
<label>element of the theme’s styling rules specifies a label style other than the advanced style itself, the specified label style is used to label the feature. In the following example, because the<label>element’s style specification (T.STATE_NAME) is different from the<features>element’s style specification (V.COUNTY_POP_DENSITY), features that fall into a bucket with no specified label style are labeled using theT.STATE_NAMEstyle:<?xml version="1.0" standalone="yes"?> <styling_rules> <rule column="TOTPOP"> <features style="V.COUNTY_POP_DENSITY"> </features> <label column="county" style="T.STATE NAME"> 1 </label> </rule> </styling_rules> -
If the
<label>element of the theme’s styling rules specifies the advanced style as its label style, the feature is not labeled. (This is why some counties in Figure: Varying Label Styles for Different Buckets are not labeled.) In the following example, because the<features>and<label>elements both specify the advanced styleV.COUNTY_POP_DENSITY, features that fall into a bucket with no specified label style are not labeled:<?xml version="1.0" standalone="yes"?> <styling_rules> <rule column="TOTPOP"> <features style="V.COUNTY_POP_DENSITY"> </features> <label column="county" style="V.COUNTY_POP_DENSITY"> 1 </label> </rule> </styling_rules>
Orienting Text Labels and Markers
You can control the orientation of text labels and markers on a map by using oriented points. The oriented point is a special type of point geometry in Oracle Spatial. In an oriented point, the coordinates represent both the location of the point and a virtual end point, to indicate an orientation vector. The text is aligned or the marker symbol is rotated according to the orientation vector, which is explained and illustrated in Controlling Marker Orientation. For more information about oriented points, see Oracle Spatial Developer’s Guide.
Controlling Text Style Orientation
To orient the text label of a point in the direction of an orientation vector, you can specify the point as an Oracle Spatial oriented point in the map request. When the map visualization component labels an oriented point, it automatically centers the text label on the point position, and aligns the label so that it points in the direction of the orientation vector.
For each feature to be so labeled, you must specify its location as an oriented point. You can group these oriented points in a single table and create a spatial index on the column containing the point geometries. You can then create a theme based on the table, specifying a desired text style as the labeling, and specifying transparent color style as the rendering style so that the points themselves are not displayed on the map.
Example: Labeling an Oriented Point is a map request that labels a single oriented point with coordinates (12,14, 0.3,0.2), where (12,14) represents the X and Y coordinates of the point and (0.3,0.2) represents the orientation vector. It renders the point using a dynamically defined transparent color style (named transparent_color) to ensure that the text is displayed but the underlying point is not displayed.
Example: Labeling an Oriented Point
<map_request
  title="Labeling Oriented Points"
  datasource="my_datasource"   width="400"  height="300"
  antialiase="true"
  format="PNG_STREAM">

  <themes>
    <theme name="theme1">
       <jdbc_query
         spatial_column="geom"  jdbc_srid="8265"
         render_style="transparent_color"
         label_column="label" label_style="t.street name"
         datasource="tilsmenv">
         SELECT SDO_GEOMETRY(2001, 8265, NULL,
                      SDO_ELEM_INFO_ARRAY(1, 1, 1, 3, 1, 0),
                      SDO_ORDINATE_ARRAY(12, 14, .3, .2))
         geom, 'Oriented Point' label FROM dual
       </jdbc_query>
     </theme>
  </themes>

  <styles>
    <style name="transparent_color">
      <svg width="1in" height="1in">
        <g class="color" style="stroke:#ff0000;stroke-opacity:0">
          <rect width="50" height="50"/>
        </g>
      </svg>
    </style>
  </styles>
</map_request>
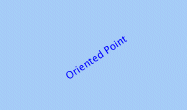
Figure: Map Display of the Label for an Oriented Point shows part of the map generated by the request in Example: Labeling an Oriented Point. (The label is the phrase Oriented Point.)
Figure: Map Display of the Label for an Oriented Point
Description of the illustration mv_oriented_pt_label.gif
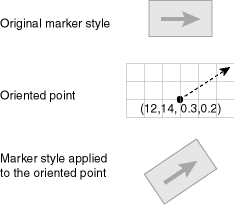
Controlling Marker Orientation
When a marker style is applied to an oriented point, the map visualization component automatically rotates the marker style so that it points to the orientation vector. Any necessary rotation of the marker style is around the center of the marker. Figure: Oriented Marker shows how you can use an oriented point to control the orientation of marker styles. In this figure, the original marker style is first shown without any rotation. However, when the marker is applied to the same oriented point shown in Example: Labeling an Oriented Point in Controlling Text Style Orientation, the marker style is rotated accordingly (in this case about 34 degrees counterclockwise) to reflect the orientation vector.
Figure: Oriented Marker
Description of the illustration oriented_marker.gif
Making a Text Style Sticky
You can specify that a text style is “sticky,” which means that any feature that uses it as a label style will always have its text label drawn on a map. Example: Text Style with Sticky Attribute shows an XML definition of a style with the sticky attribute set to true.
Example: Text Style with Sticky Attribute
<?xml version="1.0" standalone="yes"?>
<svg width="1in" height="1in">
<desc></desc>
 <g class="text" sticky="true" style = "font-style:plain;font-family:Serif;font-size:11pt;font-weight:bold;fill:#000000">
    Hello World!
</g>
</svg>
Getting a Sample Image of Any Style
To get a sample image for any pre-defined style stored in a database, you can issue a simple HTTP request to the map visualization component server. This request can specify the size of the sample image, the background color, and the format of the returned image. Such requests are useful if you want to display a visual list of styles on a web page, to build a custom map legend, or just to see how various styles will appear.
The HTTP request has the following parameters, all of which are optional except for sty:
-
sty(required) specifies the name of the style. -
dsspecifies the data source where the style can be accessed. By default, the default map visualization component data source is used. -
wspecifies the width of the sample image in pixels. The default value is 20. -
hspecifies the height of the sample image in pixels. The default value is 20. -
fspecifies the format of the sample image. Possible values arepngfor direct PNG image stream,png_urlfor the URL of a PNG image,giffor direct GIF image stream, orgif_urlfor the URL of a GIF image. The default value ispng, which means the map visualization component server will directly stream the generated PNG image data back to the client without first saving it to the server disk. -
bgspecifies the background color of the sample image. The format must be a hexadecimal string in the form of0xrrggbb, such as 0x808080 for a gray color. The default value is 0xffffff (white).For a transparent background, specify
bgas an extended hexadecimal string to include the alpha values, in the format of0xaarrggbb. For example, 0x00ffffff will make the style image’s background completely transparent, while 0x55ffffff is a white background with a transparency value of 0x55 (decimal value 80). The alpha value can range from 0x00 (completely transparent) to 0xff (completely opaque). -
aaspecifies whether the sample image should be rendered in antialiasing mode. The default value is the stringtrue. Specify the stringfalseif you do not want to use antialiasing.
The following example generates an antialiased PNG image with a gray background with the default size of 20x20 pixels, displaying the marker style named M.STAR from the map visualization component default data source:
http://www.mycorp.com/mapviewer/omserver?sty=m.star&bg=808080The preceding request generates a display similar to that in Figure: Sample Image of a Specified Marker Style.
Figure: Sample Image of a Specified Marker Style

Description of the illustration sample_image_1.gif
The following example generates an antialiased GIF image with the default white background, a width of 60 pixels, and a height of 25 pixels, displaying the line style named L.PH from the map visualization component data source named mvdemo:
http://www.mycorp.com/mapviewer/omserver?sty=l.ph&ds=mvdemo&f=gif&w=60&h=25&aa=trueThe preceding request generates a display similar to that in Figure: Sample Image of a Specified Line Style.
Figure: Sample Image of a Specified Line Style

Description of the illustration sample_image_2.gif
Allowing a Text Style to Overlap or Be Overlapped
You can specify that a text style allow-overlap, which means that any area feature, such as a polygon that uses it as a label style, will allow its text label be overlapped on a map. The following example shows an XML definition of a style with the allow-overlap attribute set to true.
<?xml version="1.0" standalone="yes"?>
<svg width="1in" height="1in">
<desc></desc>
 <g class="text" allow-overlap="true" style = "font-style:plain;font-family:Serif;font-size:11pt;font-weight:bold;fill:#000000">
    Hello World!
</g>
</svg>
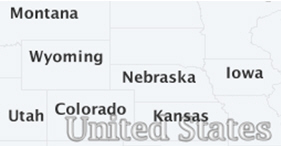
For example, if a country’s name is used as a label text, and if its style has the attribute value allow-overlap="true", then other features’ labels (such as state names) are allowed to overlap with it. The following figure shows part of a rendered map in which the country label “United States” overlaps slightly with the state labels “Colorado” and “Kansas”.
Figure: Text Style with allow-overlap=”true”