19 Using the Graph Visualization Application
Depending on the PGQL driver selected at the time of logging in, the Graph Visualization application is either connected to the database or to the graph server (PGX).
In both cases, the principal points of entry for the Graph Visualization application are the query editor and the graph list which displays the list of graphs existing either in the graph server (PGX) or in the database.
The following sections explain the application user interface and running PGQL queries for visualization in detail:
- Visualizing PGQL Queries on Graphs Loaded Into the Graph Server (PGX)
To run PGQL queries on a graph loaded into the graph server (PGX), you must login to the Graph Visualization application by selecting the Graph Server advanced option in the login screen. - Visualizing PGQL and SQL Graph Queries on Graphs in the Database
To run PGQL or SQL graph queries on graphs in the database, you must login to the Graph Visualization application by selecting the Database advanced option in the login screen. - Graph Visualization Modes
The buttons on the right let you switch between two modes: Graph Manipulation and Zoom/Move. - Graph Visualization Settings
You can click the Settings gear icon to display the Graph Visualization settings window. - Using the Geographical Layout
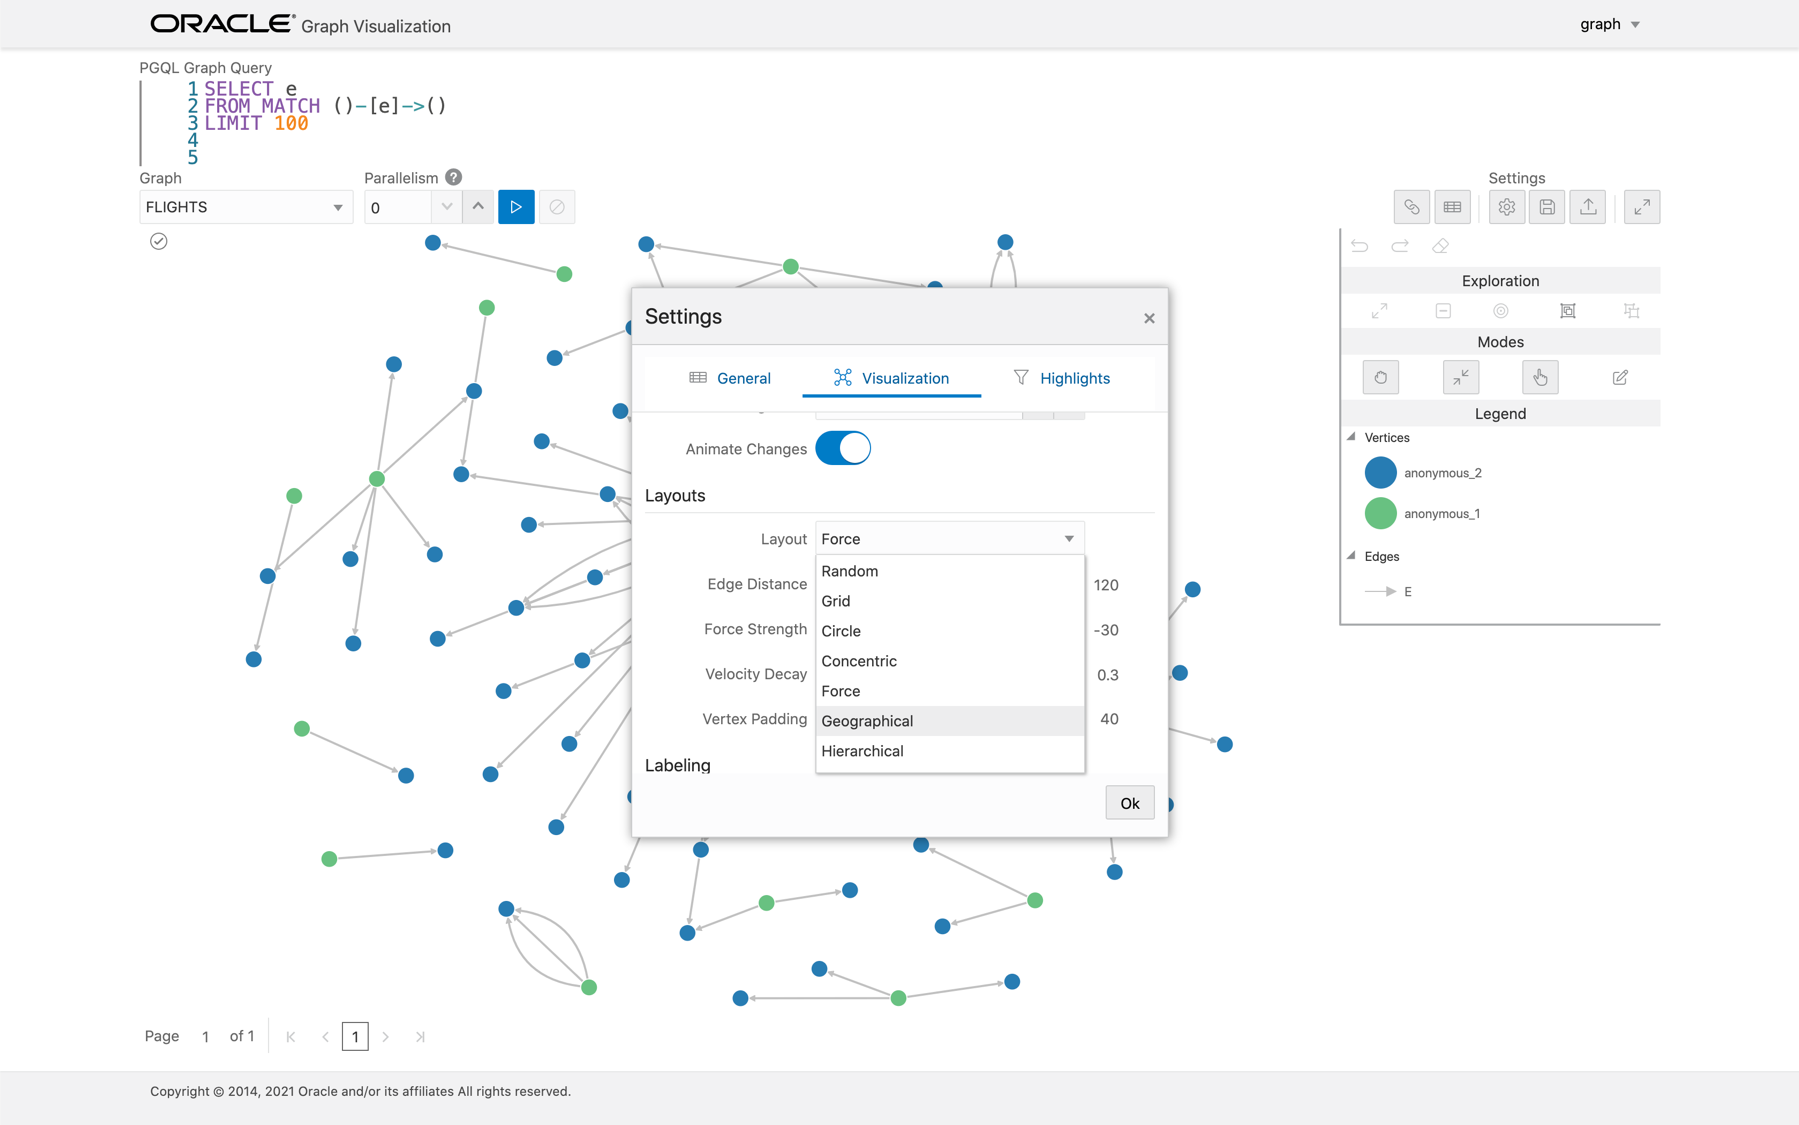
The Graph Visualization application offers a choice of layouts for rendering graphs. One of them is the Geographical layout that will show the graph (vertices and edges) on a global map. - Using Live Search
Live Search lets you to search the displayed graph and add live fuzzy search score to each item, so you can create a Highlight which visually shows the results of the search in the graph immediately. - Using URL Parameters to Control the Graph Visualization Application
You can provide the Graph Visualization application input data through URL parameters instead of using the form fields of the user interface.
Parent topic: Graph Visualization Application
19.1 Visualizing PGQL Queries on Graphs Loaded Into the Graph Server (PGX)
To run PGQL queries on a graph loaded into the graph server (PGX), you must login to the Graph Visualization application by selecting the Graph Server advanced option in the login screen.
See Configuring the Graph Visualization Application for PGQL on Graph Server (PGX) for more information.
To run queries against a graph, select that graph. The query editor lets you write PGQL queries that can be visualized. (PGQL is the SQL-like query language supported by the Graph Visualization application.)
Note:
For graphs loaded into the graph server (PGX), the graph visualization application supports only PGQLSELECT
queries. Modifying a graph using a PGQL INSERT, UPDATE
or DELETE query is not supported.
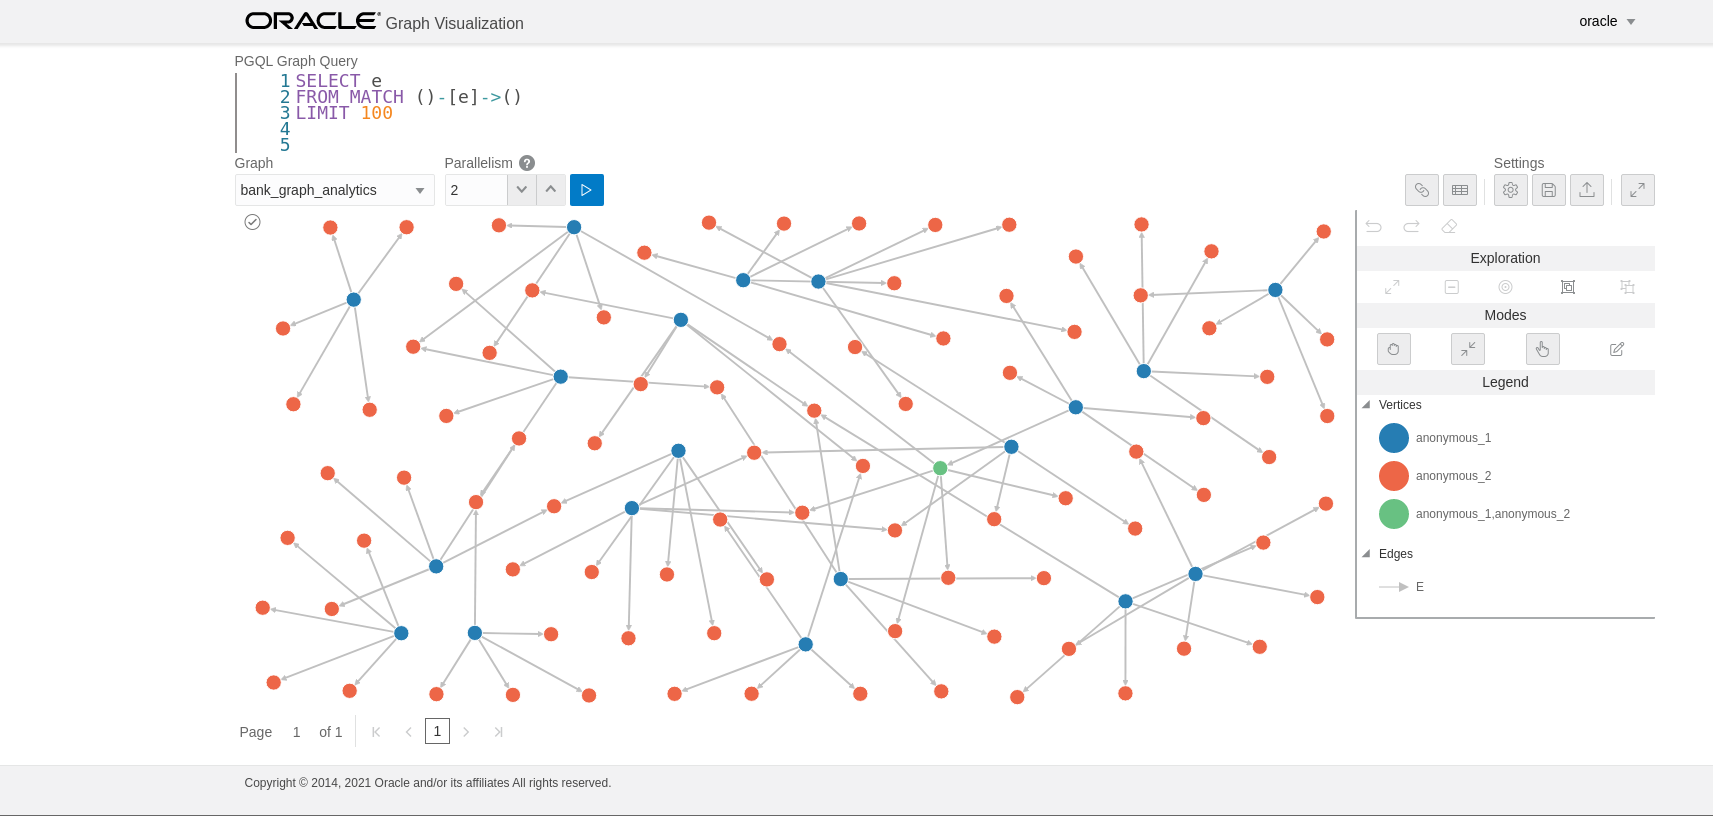
Once the query is ready and the desired graph is selected, click the Run icon to execute the query. The following figure shows a query visualization identifying all edges that are directed edges from any vertex in the graph to any other vertex.
When a query is successful, the graph visualization is displayed, including nodes and their connections. You can right-click a node or connection to display tooltip information, and you can drag the nodes around.
Parent topic: Using the Graph Visualization Application
19.2 Visualizing PGQL and SQL Graph Queries on Graphs in the Database
To run PGQL or SQL graph queries on graphs in the database, you must login to the Graph Visualization application by selecting the Database advanced option in the login screen.
See Configuring the Graph Visualization Application for PGQL on Database for more information.
The user interface for the Graph Visualization application can vary depending on the database version you are using.
For Oracle Database 23ai: The following two tab options are displayed:
- PGQL: To run PGQL queries on property graph views. See Graph Pattern Matching queries in the PGQL specification for more details.
- SQL/PGQ: To run SQL graph queries on SQL property graphs. See SQL GRAPH_TABLE Queries for more details.
For Oracle Database 21c or earlier: Only the PGQL option in the preceding list is supported.
The following sections explain with examples visualization of PGQL and SQL graph queries.
- Visualizing PGQL Queries on PG Views
You can create, query, modify and visualize property graph views (PG Views) in the database using the Graph Visualization application. - Visualizing Graph Queries on SQL Property Graphs
You can query and visualize a SQL property graph in the database using the Graph Visualization application.
Parent topic: Using the Graph Visualization Application
19.2.1 Visualizing PGQL Queries on PG Views
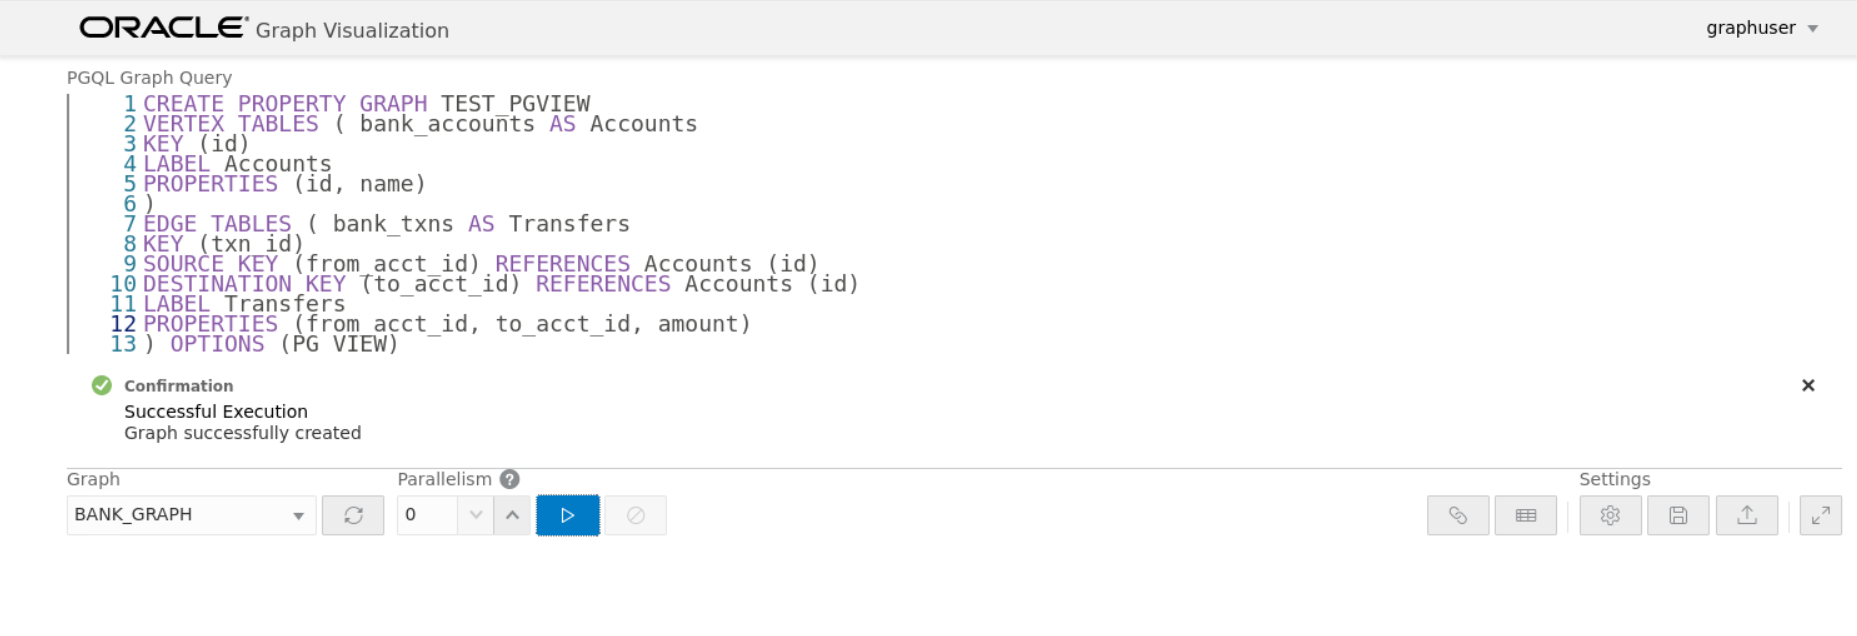
You can create, query, modify and visualize property graph views (PG Views) in the database using the Graph Visualization application.
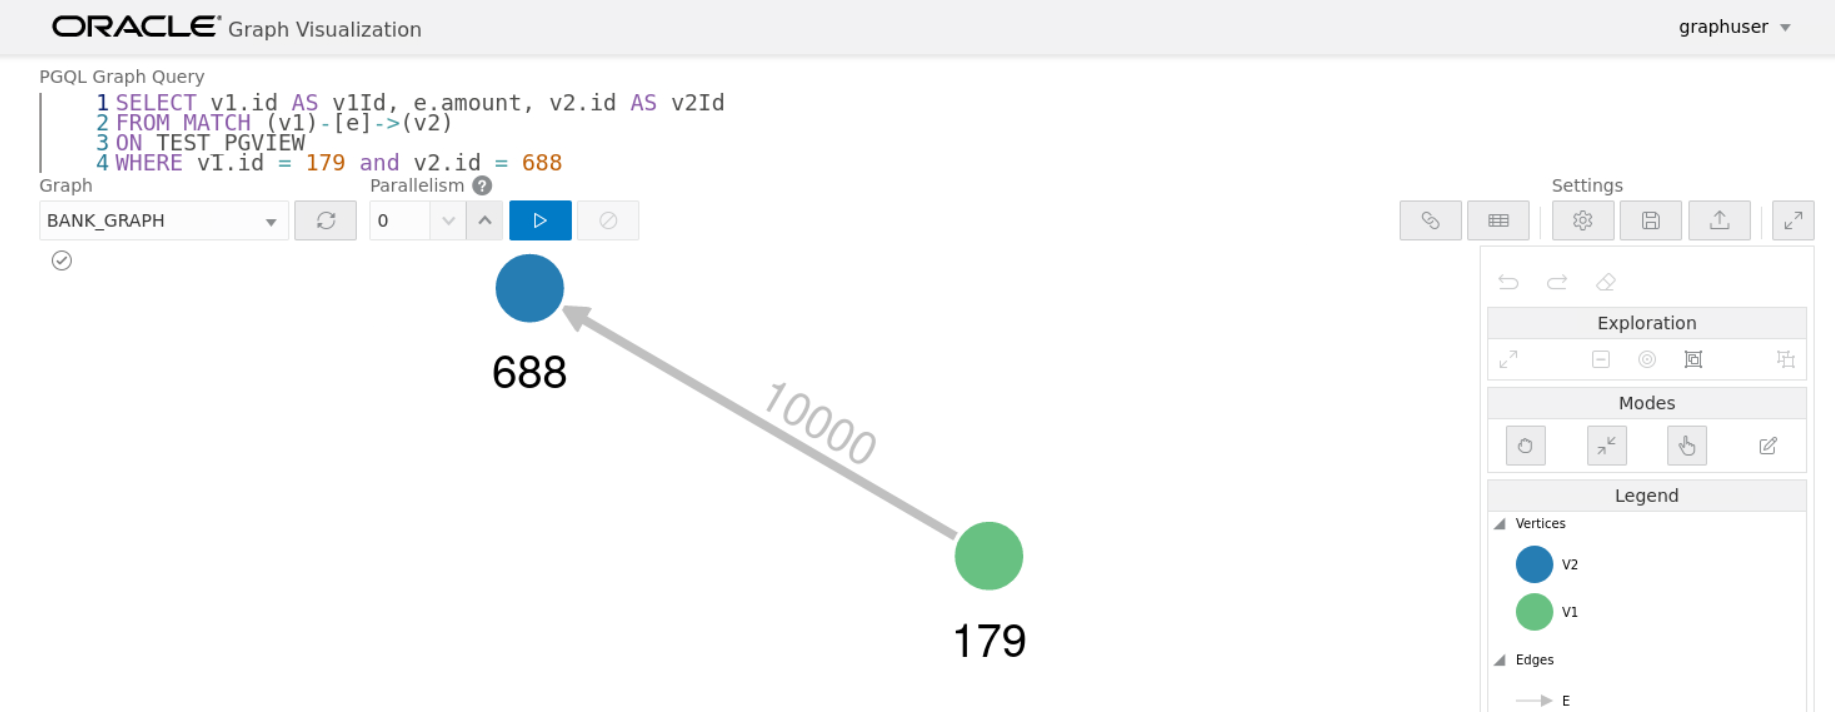
CREATE PROPERTY GRAPH: To create a new property graph as shown:INSERT,UPDATEandDELETE: To modify an existing graph. For example:SELECT: To query a property graph as shown:DROP PROPERTY GRAPH: To delete a property graph as shown:
19.2.2 Visualizing Graph Queries on SQL Property Graphs
You can query and visualize a SQL property graph in the database using the Graph Visualization application.
However, in order to visualize the vertices and edges of a
GRAPH_TABLE query together with their IDs and all their labels and
properties, the query must return the vertex ID, or edge ID, or both.
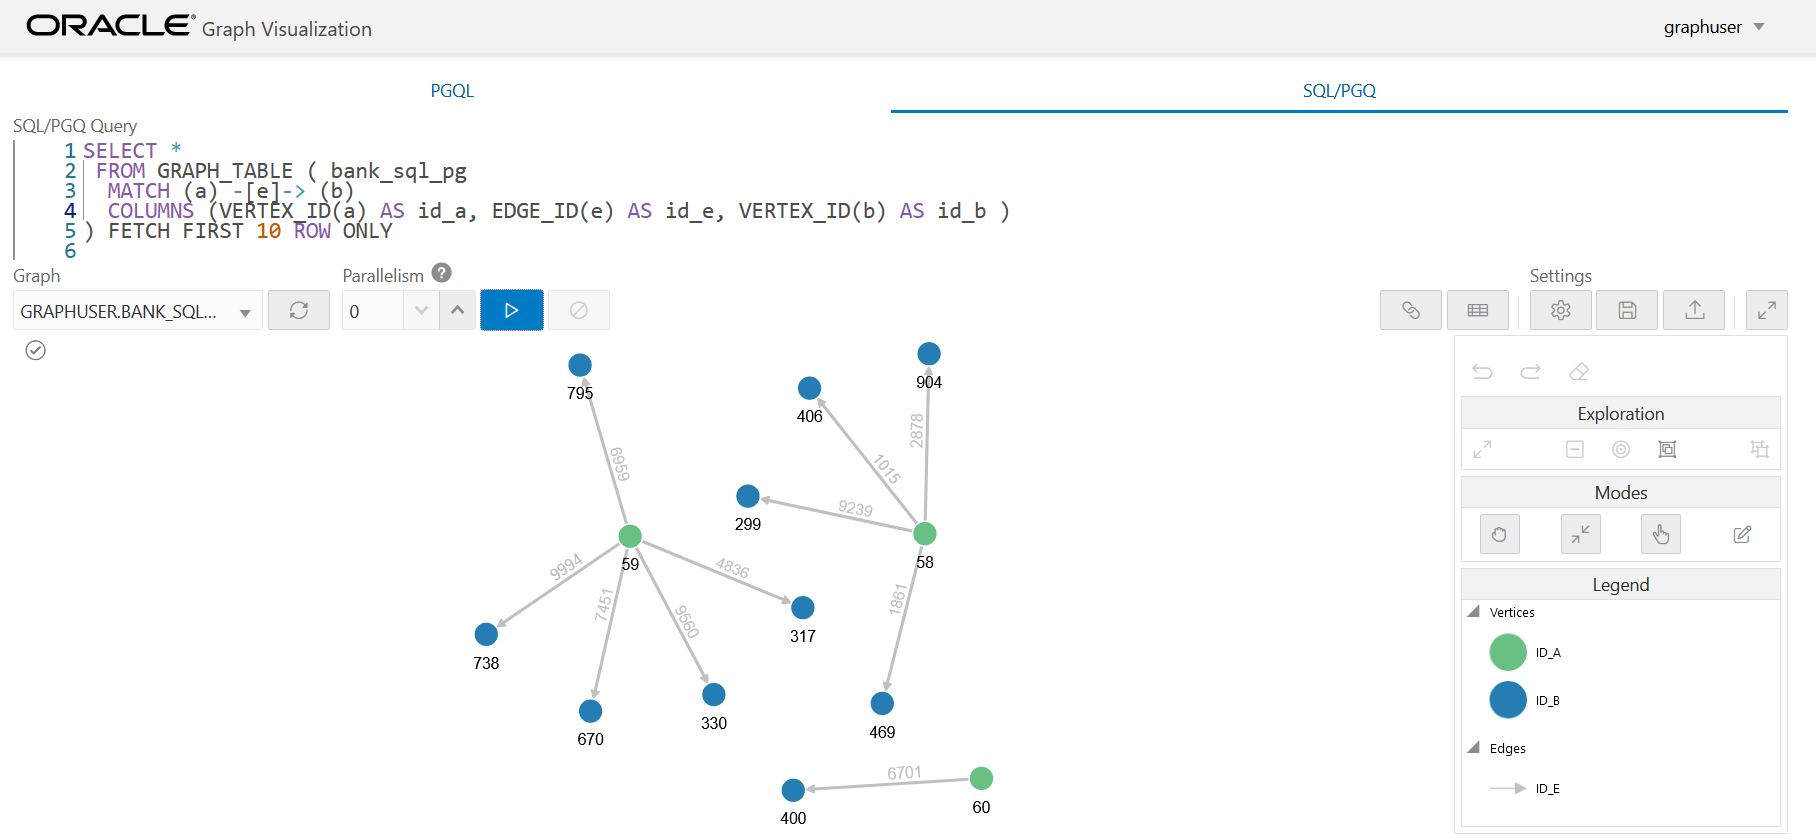
For example, the following figure shows the visualization of a SQL
GRAPH_TABLE query on a SQL property graph. Note that the
COLUMNS clause in the query uses the VERTEX_ID and
EDGE_ID operators.
Note:
In addition to the privileges mentioned in Privileges to Query a SQL Property Graph, you must also have theCREATE VIEW and
CREATE MATERIALIZED VIEW privileges to query and visualize a SQL
property graph in the Graph Visualization application.
Figure 19-7 GRAPH_TABLE Query on SQL Property Graph
Description of "Figure 19-7 GRAPH_TABLE Query on SQL Property Graph"
In the preceding example, note that the name of the graph is provided in the
GRAPH_TABLE query.
See Also:
SQL GRAPH_TABLE Queries for more information19.3 Graph Visualization Modes
The buttons on the right let you switch between two modes: Graph Manipulation and Zoom/Move.
- Graph Manipulation mode lets you execute actions that modify the visualization. These actions include:
- Drop removes selected vertices from visualization. Can also be executed from the tooltip.
- Group selects multiple vertices and collapses them into a single one.
- Ungroup selects a group of collapsed vertices and ungroups them.
- Expand retrieves a configurable number of neighbors (hops) of selected vertices. Can also be executed from the tooltip.
- Focus, like Expand, retrieves a configurable number of neighbors, but also drops all other vertices. Can also be executed from the tooltip.
- Undo undoes the last action.
- Redo redoes the last action.
- Reset resets the visualization to the original state after the query.
- Zoom/Move mode lets you zoom in and out, as well as to move to another part of the visualization. The Pan to Center button resets the zoom and returns the view to the original one.
An additional mode, called Sticky mode, lets you cancel the action of dragging the nodes around.
Parent topic: Using the Graph Visualization Application
19.4 Graph Visualization Settings
You can click the Settings gear icon to display the Graph Visualization settings window.
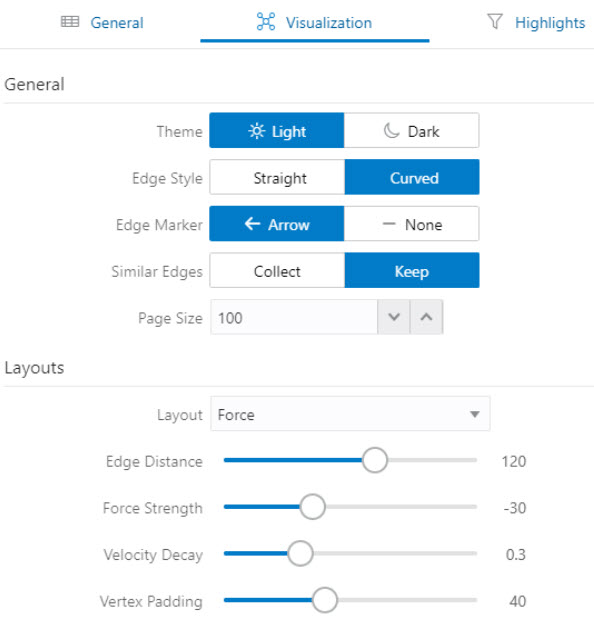
The settings window lets you modify some parameters for the visualization, and it has tabs for General, Visualization, and Highlights. The following figure shows this window, with the Visualization tab selected.
Figure 19-8 Graph Visualization Settings Window
Description of "Figure 19-8 Graph Visualization Settings Window"
The General tab includes the following:
- Number of hops: The configurable number of hops for the expand and focus actions.
- Truncate label: Truncates the label if it exceeds the maximum length.
- Max. visible label length: Maximum length before truncating.
- Show Label On Hover: Controls whether the label is shown on hover.
- Display the graph legend: Controls whether the legend is displayed.
The Visualization tab includes the following:
- Theme: Select a light or dark mode.
- Edge Style: Select straight or curved edges.
- Edge Marker: Select arrows or no edge marker. This only applies to directed edges.
- Similar Edges: Select keep or collect.
- Page Size: Specify how many vertices and edges are displayed per page.
- Layouts: Select between different layouts (random, grid, circle, concentric, ...).
- Vertex Label: Select which property to use as the vertex label.
- Vertex Label Orientation: Select the relative position of the vertex label.
- Edge Label: Select which property to use as the edge label.
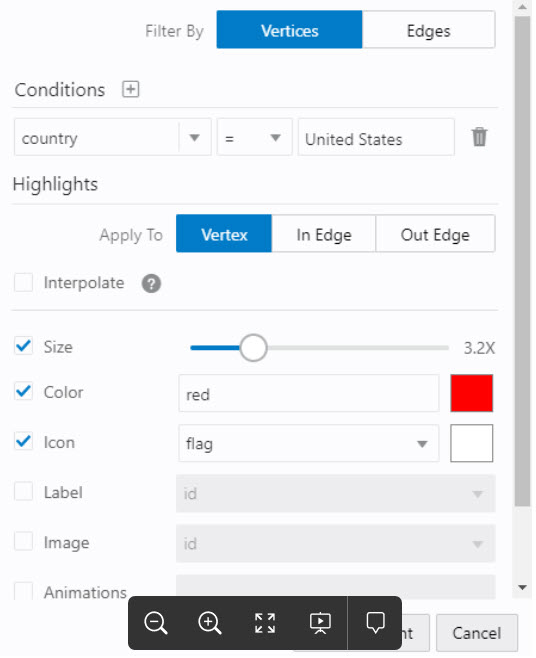
The Highlights tab includes customization options that let you modify the appearance of edges and vertices. Highlighting can be applied based on conditions (filters) on single or multiple elements. The following figure shows a condition (country = United States) and visual highlight options for vertices.
Figure 19-9 Highlights Options for Vertices
Description of "Figure 19-9 Highlights Options for Vertices"
A filter for highlights can contain multiple conditions on any property of the element. The following conditions are supported.
=(equal to)<(less than)<=(less than or equal to)>(greater than)>=(greater than or equal to)!=(not equal to)~(filter is a regular expression)*(any: like a wildcard, can match to anything)
The visual highlight customization options include:
- Edges:
- Width
- Color
- Label
- Style
- Animations
- Vertices:
- Size
- Color
- Icon
- Label
- Image
- Animations
You can export and import highlight options by clicking the Save and Import buttons in the main window. Save lets you persist the highlight options, and Load lets you apply previously saved highlight options.
When you click Save, a file is saved containing a JSON object with the highlights configuration. Later, you can load that file to restore the highlights of the saved session.
Parent topic: Using the Graph Visualization Application
19.5 Using the Geographical Layout
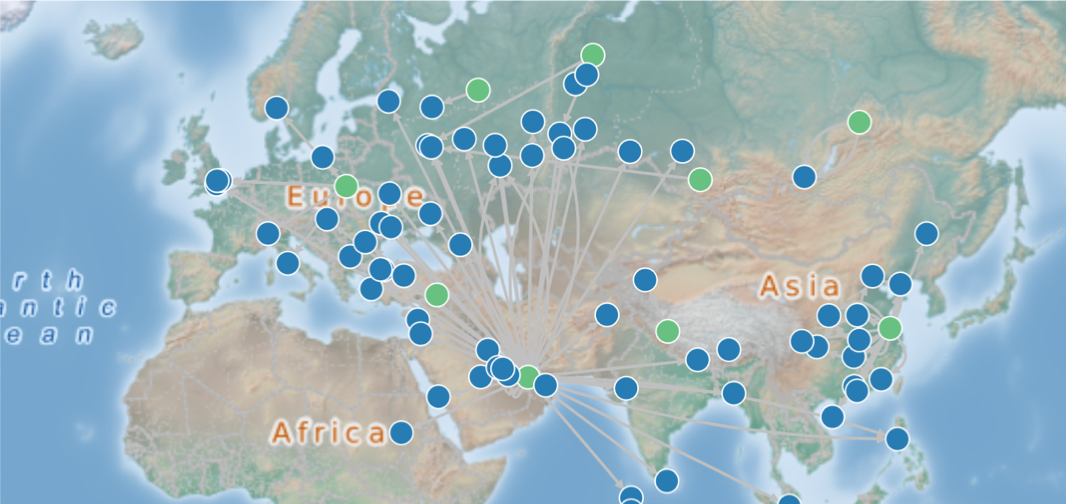
The Graph Visualization application offers a choice of layouts for rendering graphs. One of them is the Geographical layout that will show the graph (vertices and edges) on a global map.
+-------------------------------------------------+
| iata | city        | longitude    | latitude    |
+-------------------------------------------------+
| SIN  | Singapore   | 103.994003   | 1.35019     |
| LAX  | Los Angeles | -118.4079971 | 33.94250107 |
| MUC  | Munich      | 11.7861      | 48.353802   |
| CDG  | Paris       | 2.55         | 49.012798   |
| LHR  | London      | -0.461941    | 51.4706     |
+-------------------------------------------------+
Note:
You can use any name for the longitude and latitude properties (such as X and Y, or long and lat). But, you must ensure that the longitude/latitude pair are in the WGS84 system (GPS coordinates), and the coordinates are expressed in decimal degrees.Then, select the properties in your vertices that contain the geographical coordinates as shown:
Figure 19-12 Selecting the Coordinates for the Geographical layout
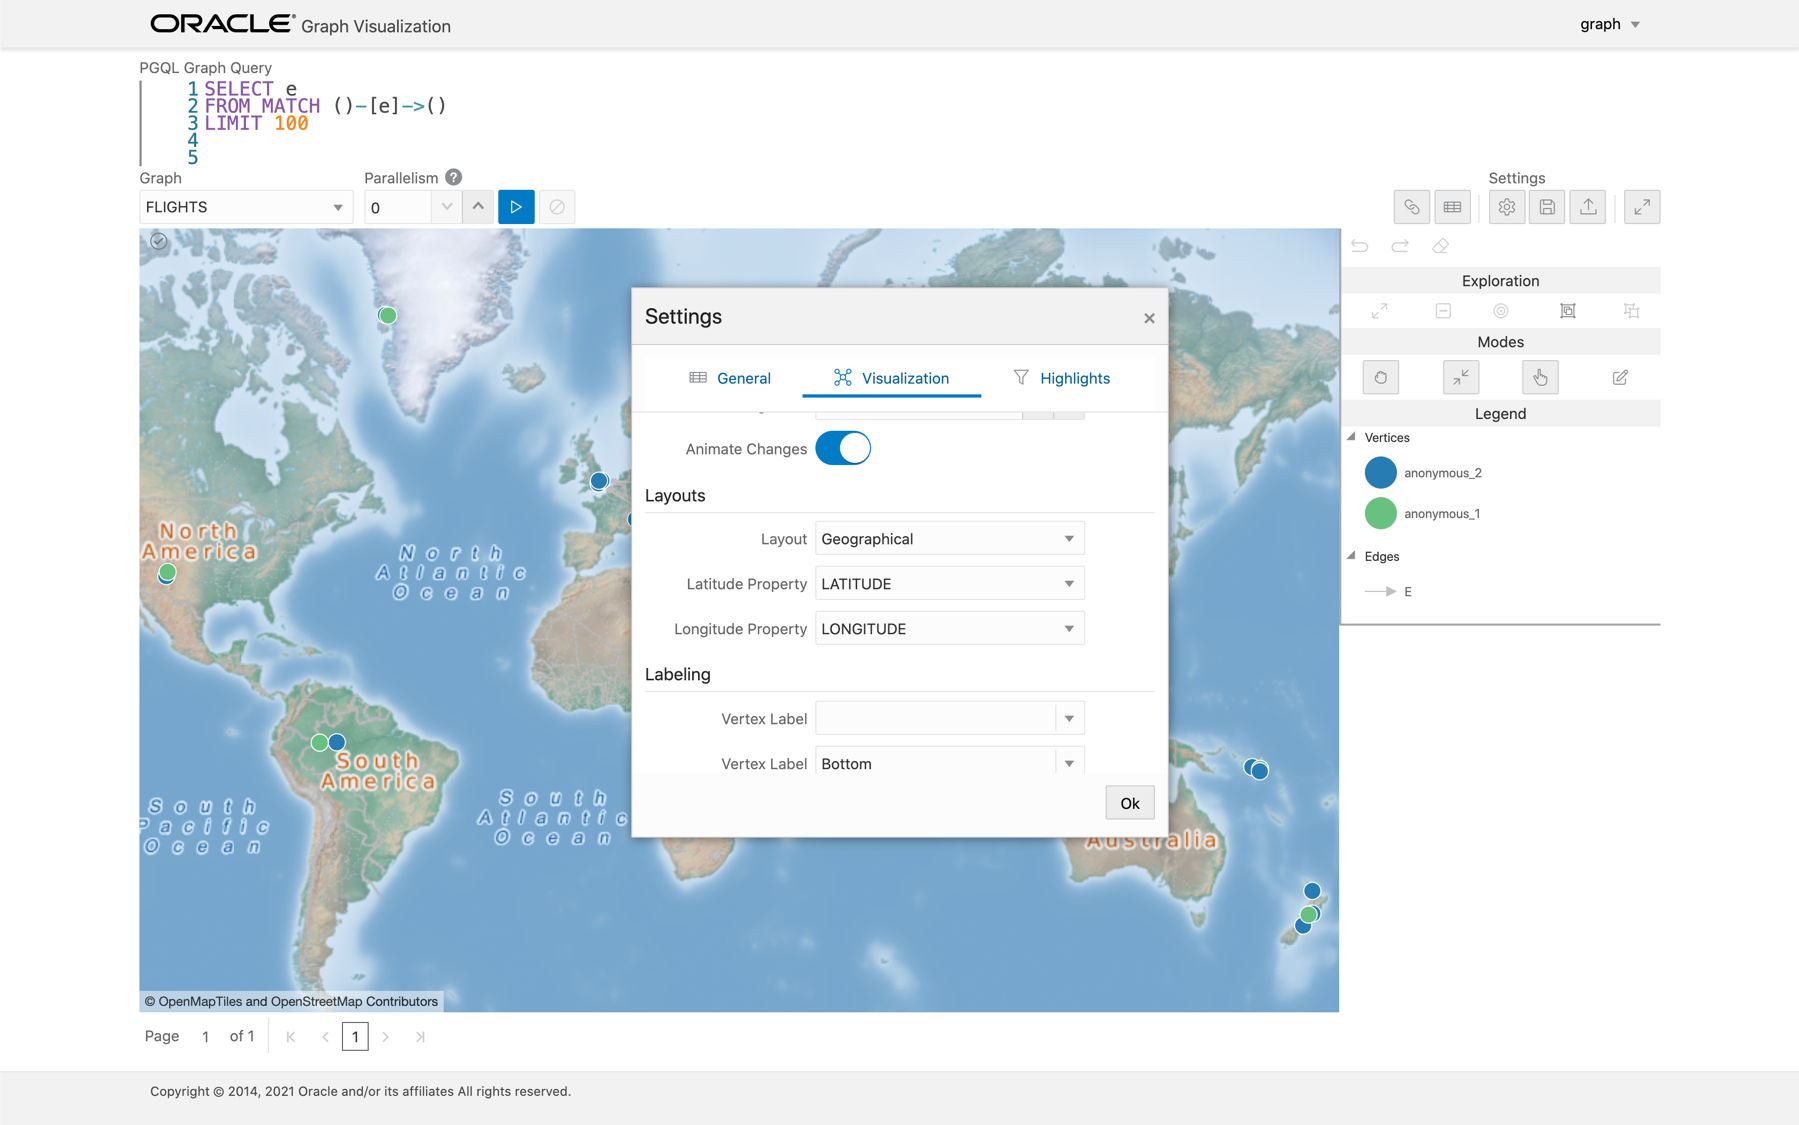
Description of "Figure 19-12 Selecting the Coordinates for the Geographical layout"
You can now move around the map and zoom in/out using your mouse or trackpad. From now on, whenever you enter a new PGQL query, the map will automatically center and zoom the vertices returned by the query.
Parent topic: Using the Graph Visualization Application
19.6 Using Live Search
Live Search lets you to search the displayed graph and add live fuzzy search score to each item, so you can create a Highlight which visually shows the results of the search in the graph immediately.
If you run a query, and a graph is displayed, you can add the live search, which is on the settings dialog. On the bottom of the General tab, you will see these options.
- Enable Live Search: Enables the Live Search feature, adds the search input to the visualization, and lets you further customize the search.
- Enable Search In: You can select whether you want to search the properties of Vertices, Edges, or both.
- Properties To Search: Based on what you selected for Enable Search In, you can set one or more properties to search in. For example, if you disable the search for edges but you had a property from edges selected, it will be stored and added back when you enable search for the edges again. (This also works for vertices.)
- Advanced Settings: You can fine-tune the search even more. Each of the advanced options is documented with context help, visible upon enabling.
- Location: Determines approximately where in the text the pattern is expected to be found.
- Distance: Determines how close the match must be to the fuzzy location (specified by location). An exact letter match which is distance characters away from the fuzzy location would score as a complete mismatch. A distance of 0 requires the match be at the exact location specified, a distance of 1000 would require a perfect match to be within 800 characters of the location to be found using a threshold of 0.8.
- Maximum Pattern Length: The maximum length of the pattern. The longer the pattern (that is, the search query), the more intensive the search operation will be. Whenever the pattern exceeds this value, an error will be thrown.
- Min Char Match: The minimum length of the pattern. Whenever the pattern length is below this value, an error will be thrown.
When the search is enabled, the input will be displayed in the top left part of the Graph Visualization component. If you start typing, the search will add a score to every vertex or edge, based on the settings and the search match.
To be able to see the results visually, you have to add a Highlight with interpolation set to a Live Search score and other settings based on the desired visual change.
Parent topic: Using the Graph Visualization Application
19.7 Using URL Parameters to Control the Graph Visualization Application
You can provide the Graph Visualization application input data through URL parameters instead of using the form fields of the user interface.
If you supply the parameters in the URL, the Graph Visualization application automatically executes the specified query and hides the input form fields from the screen, so only the resulting visualization output is visible. This feature is useful if you want to embed the resulting graph visualization into an existing application, such as through an iframe. However, it is important to note that the application must run on the same domain as the graph visualization application.
The following table specifies the available URL parameters:
Table 19-1 Available URL Parameters
| Parameter Name | Value (must be URL encoded) | Type | Optional? |
|---|---|---|---|
| graph | Graph name | string | No |
| parallelism | Degree of parallelism desired | number | Yes (defaults to server-side default parallelism) |
| query | PQL query | string | No |
The following URL shows an example of visualizing the PGQL query SELECT v, e MATCH (v) -[e]-> () LIMIT 10 on graph myGraph with parallelism 4:
https://myhost:7007/ui/?query=SELECT%20v%2C%20e%20MATCH%20%28v%29%20-%5Be%5D-%3E%20%28%29%20LIMIT%2010&graph=myGraph¶llelism=4Parent topic: Using the Graph Visualization Application
