8 Visualizing SQL Graph Queries Using the APEX Graph Visualization Plug-in

You can use the Oracle Application Express (APEX) Graph Visualization plug-in to visualize and interact with SQL property graphs in an APEX application.

The following topics explain more about the plug-in:

8.1 About the APEX Graph Visualization Plug-in

The APEX Graph Visualization plug-in integrates a Java Script Library that supports graph visualization in APEX applications.

See Graph JavaScript API Reference for Property Graph Visualization for more information.

The plug-in mainly allows you to:

  • Visualize SQL property graph queries from the graph data in your database.
  • Explore the graph vertices and edges. You can also select and visualize these graph elements individually or in groups.
  • Interact with the graph visualization by performing various actions such as changing the graph layouts, grouping or ungrouping selected vertices, removing selected vertices or edges, and so on.
  • Style the vertices and edges in the graph by configuring the style settings such as size, color, icon, label values, and so on.
  • Visualize and study the evolution of the graph over time.

The following figure shows an example of graph visualization in an APEX application using the plug-in:
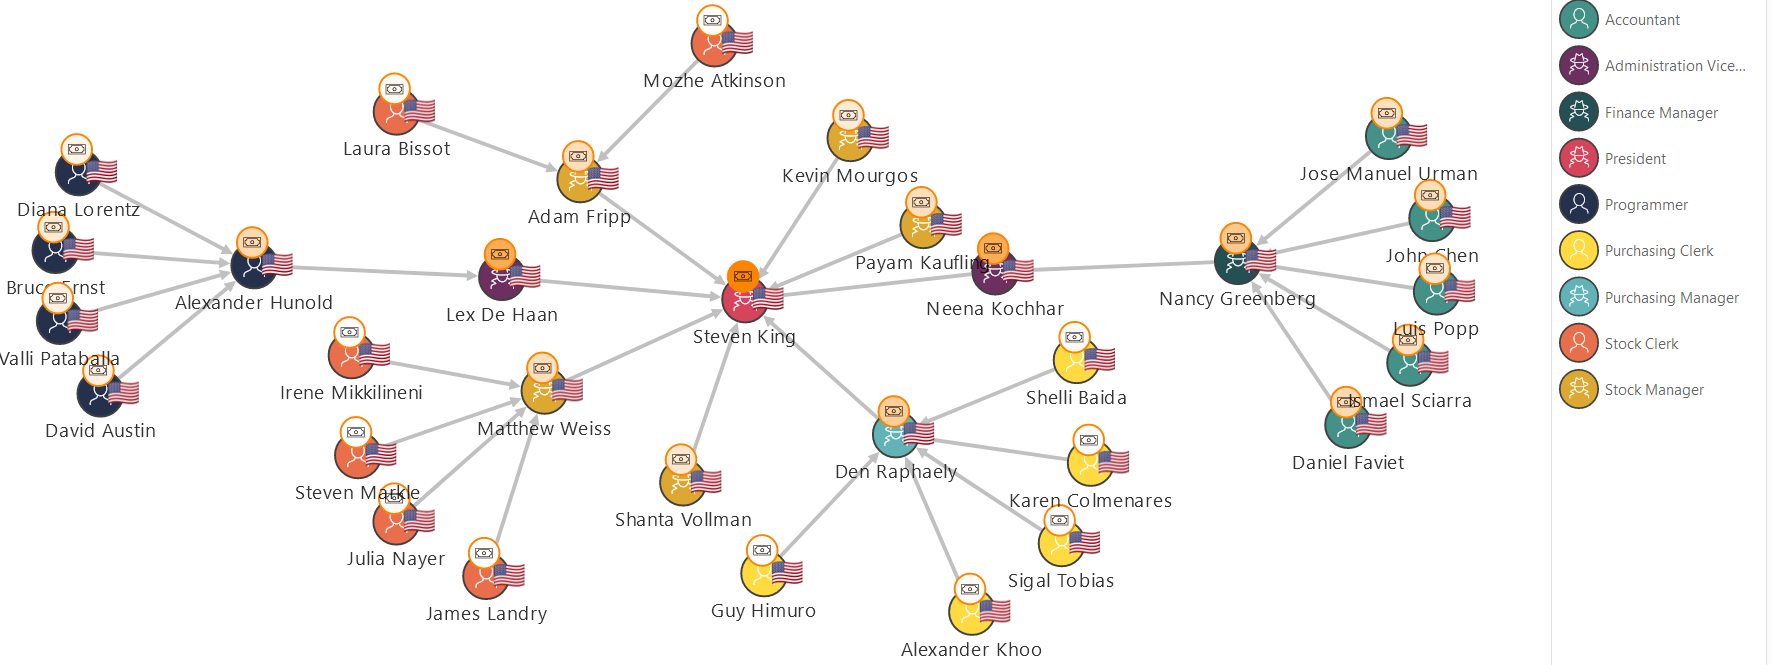
Description of apex_graphviz_plugin.png follows
Description of the illustration apex_graphviz_plugin.png

8.2 Getting Started with the APEX Graph Visualization Plug-in

This section helps you get started with the Graph Visualization plug-in in your APEX application.

Before you get started, ensure that your APEX workspace meets the following requirements:
  • The target application into which you want to import the plug-in exists.
  • The SQL property graph to be used for visualization exists in the default database schema.

    Using the command editor in the SQL Workshop component, you can create a SQL property graph using the CREATE PROPERTY GRAPH DDL statement (see Using the Command Editor).

  1. Download the Graph Visualization (Preview) plug-in from Oracle APEX GitHub repository.
  2. Sign in to your APEX workspace (see Signing In to Your Workspace).
  3. Import the downloaded plug-in script (region_type_plugin_graphviz.sql) file into your target APEX application (see Importing Plug-ins).
    It is important to note that the plugin accepts the input SQL graph query in JSON format only. This is supported by the ORA_SQLGRAPH_TO_JSON PL/SQL function.
  4. Create the ORA_SQLGRAPH_TO_JSON function in your APEX workspace.
    1. Click Graph Visualization (Preview) on the Oracle APEX Plug-ins page.
    2. Download the gvt_sqlgraph_to_json.sql file from the /optional-23c-only folder.
    3. Upload and run the gvt_sqlgraph_to_json.sql script in your APEX workspace (see Uploading a SQL Script).
    This step creates the ORA_SQLGRAPH_TO_JSON function in the database. Note that the ORA_SQLGRAPH_TO_JSON function accepts only CURSOR as input. Therefore you need to provide the SQL graph query into a CURSOR using a helper function.
  5. Create a helper function (see Running a SQL Command) to provide the CURSOR for the SQL graph query and subsequently obtain the JSON output from the ORA_SQLGRAPH_TO_JSON function.
    For example:
    CREATE OR REPLACE FUNCTION bank_sqlgraph_json (
      QUERY VARCHAR2
    ) RETURN CLOB
      AUTHID CURRENT_USER IS
      INCUR    SYS_REFCURSOR;
      L_CUR    NUMBER;
      RETVALUE CLOB;
    BEGIN
      OPEN INCUR FOR QUERY;
      L_CUR := DBMS_SQL.TO_CURSOR_NUMBER(INCUR);
      RETVALUE := ORA_SQLGRAPH_TO_JSON(L_CUR);
      DBMS_SQL.CLOSE_CURSOR(L_CUR);
      RETURN RETVALUE;
    END;
  6. Implement the plug-in in an application page to perform various graph visualizations.

    The following basic example describes the steps to visualize a graph existing in your database using the Graph Visualization plug-in.

    1. Open the application page in Page Designer.
    2. Select the Rendering tab on the left pane of the Page Designer.
    3. Right-click an existing component and add a new region component.
    4. Select the new region and configure the following attributes in the Region tab of the Property Editor on the right pane of the Page Designer:
      1. Enter the Identification Title.
      2. Select Graph Visualization (Preview) as Identification Type.
      3. Select the source Location as Local Database.
      4. Select Type as SQL Query.
      5. Embed a SQL graph query to retrieve the graph data.

        For instance, the SQL graph query in the following example, is provided as input to the bank_sqlgraph_json helper function created in the preceding step:

        SELECT bank_sqlgraph_json('SELECT id_a, id_e, id_b FROM GRAPH_TABLE (bank_sql_pg
          MATCH (a IS accounts) -[e IS transfers]-> (b IS accounts)
            WHERE a.id = 816
            COLUMNS (vertex_id(a) AS id_a, edge_id(e) AS id_e, vertex_id(b) AS id_b)
          )'
        ) AS result_column FROM DUAL;

        Note that a column alias need to be provided after the function.

    5. Run the application page to visualize the graph rendered by the plugin.

      Figure 8-1 Visualizing a SQL Graph Query in an APEX Application

      Description of Figure 8-1 follows
      Description of "Figure 8-1 Visualizing a SQL Graph Query in an APEX Application"
  7. Optionally, you can import and run the Sample Graph Visualizations application from Oracle APEX GitHub repository.

8.2.1 Importing the Sample Graph Visualizations Application in APEX

The Sample Graph Visualizations application demonstrates the use of the Graph Visualization plug-in.

Perform the following steps to import the Sample Graph Visualizations application:
  1. Download the Sample Graph Visualizations application from Oracle APEX GitHub repository.
  2. Import the downloaded sample-graph-visualizations.zip into your APEX instance by following the steps in Importing an Application.
    You can directly run the sample application once it is installed.

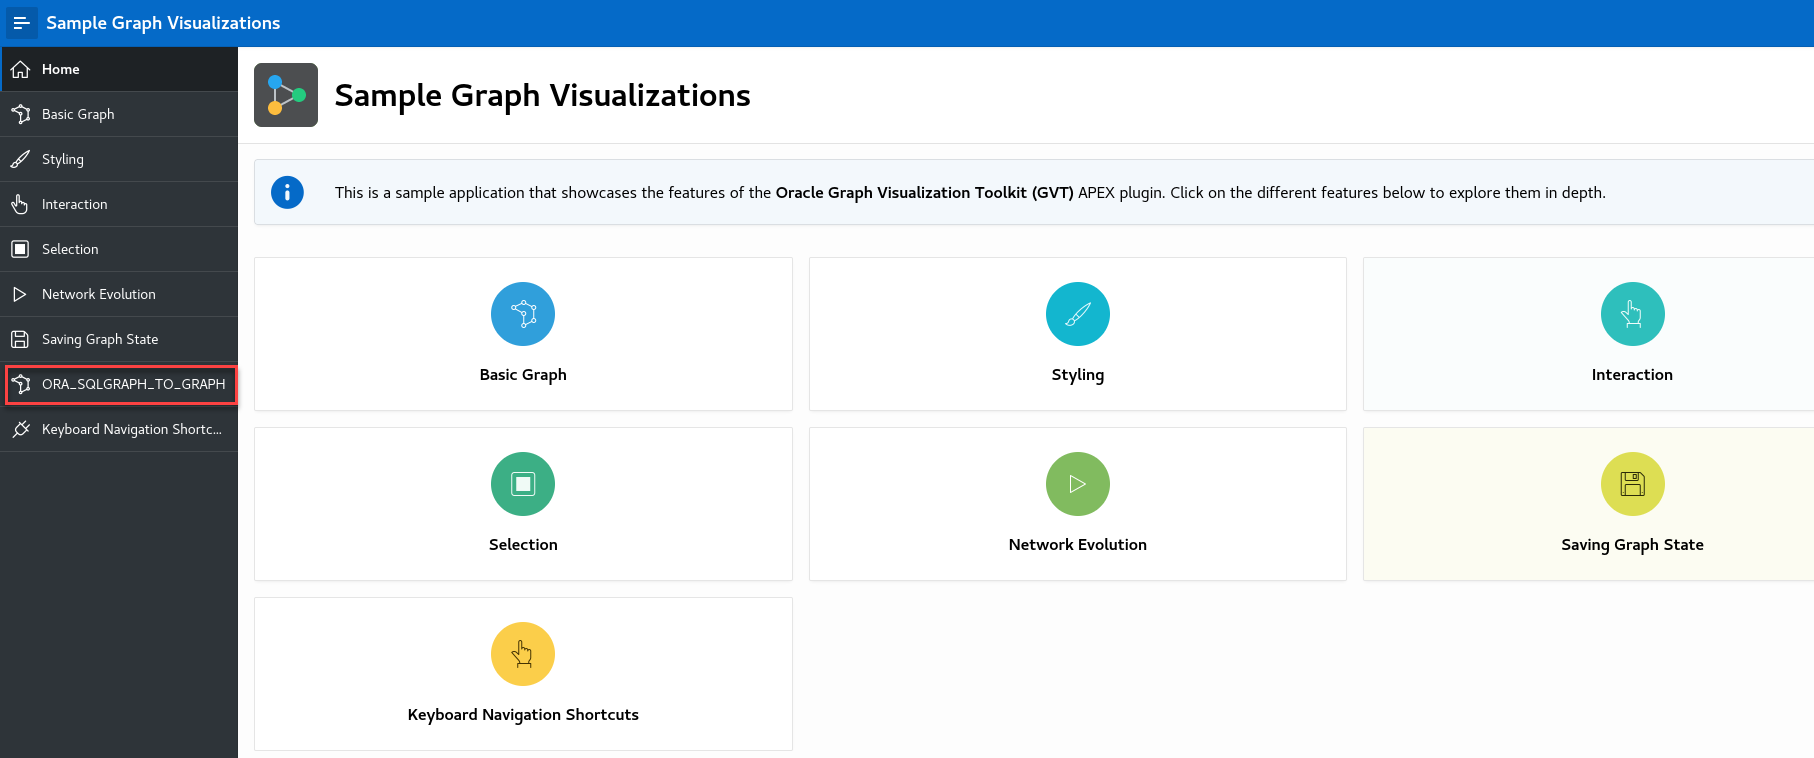
    Figure 8-2 Sample Graph Visualization Home Page

    Description of Figure 8-2 follows
    Description of "Figure 8-2 Sample Graph Visualization Home Page"

    Also, note that the sample application requires a secure HTTPS connection. If you want to disable secure connection, then perform the following steps:

    Caution:

    It is not recommended to disable secure connections in production deployment.
    1. Navigate to the sample application home page in App Builder.
    2. Click Shared Components.
    3. Click Authentication Schemes under Security.
    4. Click the Current authentication scheme.
    5. Click the Session Sharing tab and turn off the Secure switch.
    6. Click Apply Changes and then run the application.

To view the visualization for a SQL property graph query using the ORA_SQLGRAPH_TO_JSON function (shown highlighted in the preceding figure), you need to perform the following additional steps:

  1. Create the ORA_SQLGRAPH_TO_JSON function if it is not already added in your APEX workspace.
    1. Click Graph Visualization (Preview) on the Oracle APEX Plug-ins page.
    2. Download the gvt_sqlgraph_to_json.sql file from the /optional-23c-only folder.
    3. Upload and run the gvt_sqlgraph_to_json.sql script in your APEX workspace (see Uploading a SQL Script).
  2. Create the SQL property graph used by the sample application.
    Using the command editor in the SQL Workshop component, run the following CREATE PROPERTY GRAPH DDL statement:
    CREATE PROPERTY GRAPH EBA_SAMPLE_GRAPH
      VERTEX TABLES (
        eba_graphviz_countries
          KEY ( country_id )
          LABEL country PROPERTIES ( country_id, country_name, region_id ),
        eba_graphviz_departments
          KEY ( department_id )
          LABEL department PROPERTIES ( department_id, department_name, location_id, manager_id ),
        eba_graphviz_locations
          KEY ( location_id )
          LABEL location PROPERTIES ( city, country_id, location_id, postal_code, state_province, street_address ),
        eba_graphviz_job_history
          KEY ( employee_id, end_date, job_id, start_date )
          PROPERTIES ( department_id, employee_id, end_date, job_id, start_date ),
        eba_graphviz_jobs
          KEY ( job_id )
          LABEL job PROPERTIES ( job_id, job_title, max_salary, min_salary ),
        eba_graphviz_regions
          KEY ( region_id )
          LABEL region PROPERTIES ( region_id, region_name ),
        eba_graphviz_employees
          KEY ( employee_id )
          LABEL employee PROPERTIES ( commission_pct, department_id, email, employee_id, first_name, hire_date, job_id, last_name, manager_id, phone_number, salary )
      )
      EDGE TABLES (
        eba_graphviz_countries AS country_located_in
          SOURCE KEY ( country_id ) REFERENCES eba_graphviz_countries (country_id)
          DESTINATION KEY ( region_id ) REFERENCES eba_graphviz_regions (region_id)
          NO PROPERTIES,
        eba_graphviz_departments AS department_located_in
          SOURCE KEY ( department_id ) REFERENCES eba_graphviz_departments (department_id)
          DESTINATION KEY ( location_id ) REFERENCES eba_graphviz_locations ( location_id )
          NO PROPERTIES,
        eba_graphviz_locations AS location_located_in
          SOURCE KEY ( location_id ) REFERENCES eba_graphviz_locations ( location_id )
          DESTINATION KEY ( country_id ) REFERENCES eba_graphviz_countries ( country_id )
          NO PROPERTIES,
        eba_graphviz_employees AS works_as
          SOURCE KEY ( employee_id ) REFERENCES eba_graphviz_employees ( employee_id )
          DESTINATION KEY ( job_id ) REFERENCES eba_graphviz_jobs ( job_id )
          NO PROPERTIES,
        eba_graphviz_employees AS works_at
          SOURCE KEY ( employee_id ) REFERENCES eba_graphviz_employees  ( employee_id ) 
          DESTINATION KEY ( department_id ) REFERENCES eba_graphviz_departments ( department_id ) 
          NO PROPERTIES,
        eba_graphviz_employees AS works_for
          SOURCE KEY ( employee_id ) REFERENCES eba_graphviz_employees ( employee_id )
          DESTINATION KEY ( manager_id ) REFERENCES eba_graphviz_employees  ( employee_id )
          NO PROPERTIES,
        eba_graphviz_job_history AS for_job KEY ( employee_id, start_date )
          SOURCE KEY ( employee_id, start_date ) REFERENCES eba_graphviz_job_history ( employee_id, start_date )
          DESTINATION KEY ( job_id ) REFERENCES eba_graphviz_jobs ( job_id )
          NO PROPERTIES,
        eba_graphviz_job_history AS for_department KEY ( employee_id, start_date )
          SOURCE KEY ( employee_id, start_date ) REFERENCES eba_graphviz_job_history ( employee_id, start_date )
          DESTINATION KEY ( department_id ) REFERENCES eba_graphviz_departments ( department_id )
          NO PROPERTIES,
        eba_graphviz_job_history AS for_employee KEY ( employee_id, start_date )
          SOURCE KEY ( employee_id, start_date ) REFERENCES eba_graphviz_job_history ( employee_id, start_date ) 
          DESTINATION KEY ( employee_id ) REFERENCES eba_graphviz_employees  ( employee_id )
          NO PROPERTIES
      )
  3. Create the following helper function (see Running a SQL Command) used by the sample application to provide the CURSOR for the SQL graph query.
    CREATE OR REPLACE FUNCTION CUST_SQLGRAPH_JSON (
      QUERY VARCHAR2
    ) RETURN CLOB
      AUTHID CURRENT_USER IS
      INCUR    SYS_REFCURSOR;
      L_CUR    NUMBER;
      RETVALUE CLOB;
    BEGIN
      OPEN INCUR FOR QUERY;
      L_CUR := DBMS_SQL.TO_CURSOR_NUMBER(INCUR);
      RETVALUE := ORA_SQLGRAPH_TO_JSON(L_CUR);
      DBMS_SQL.CLOSE_CURSOR(L_CUR);
      RETURN RETVALUE;
    END;
  4. Navigate to App Builder and from the sample application home page open the ORA_SQLGRAPH_TO_JSON Query page in Page Designer.
    1. Select the Graph Using ORA_SQLGRAPH_TO_JSON Function component in the Rendering tab on the left pane of the Page Designer.
    2. Uncomment the SQL query (using the CUST_SQLGRAPH_JSON helper function) under Source in the Region tab on the right pane of the Page Designer (Property Editor) .

      Also, ensure that the SQL Query input contains only one query as shown:

      SELECT CUST_SQLGRAPH_JSON('SELECT employee, e, manager
          FROM GRAPH_TABLE ( EBA_SAMPLE_GRAPH
          MATCH (worker is employee) -[w is works_for]-> (boss is employee)
          COLUMNS (vertex_id(worker) AS employee, edge_id(w) AS e, vertex_id(boss) AS manager )
      )') as result_column FROM DUAL;
    3. Click Save and run the application page to view the visualization for the SQL graph query as rendered by the plug-in.

8.2.2 Graph Visualization with Pagination

You can implement pagination when using the ORA_SQLGRAPH_TO_JSON function.

The instructions in Getting Started with the APEX Graph Visualization Plug-in guides you to set up the Graph Visualization plug-in in your APEX application. However, to use pagination with the ORA_SQLGRAPH_TO_JSON function, you must ensure the following:
  • Switch ON the SQL Query Supports Pagination setting in the Attributes tab of the Property Editor for the graph visualization component in your APEX application.
  • Add the page_start and page_size parameters in the helper function as shown in the following example code:
    CREATE OR REPLACE FUNCTION bank_sqlgraph_json (
      QUERY VARCHAR2,
      PAGE_START NUMBER DEFAULT -1,
      PAGE_SIZE NUMBER DEFAULT -1
      ) RETURN CLOB
      AUTHID CURRENT_USER IS
      INCUR    SYS_REFCURSOR;
      L_CUR    NUMBER;
      RETVALUE CLOB;
    BEGIN
      OPEN INCUR FOR QUERY;
      L_CUR := DBMS_SQL.TO_CURSOR_NUMBER(INCUR);
      RETVALUE := ORA_SQLGRAPH_TO_JSON(L_CUR, PAGE_START, PAGE_SIZE);
      DBMS_SQL.CLOSE_CURSOR(L_CUR);
      RETURN RETVALUE;
    END;
  • Bind variables to page_start and page_size when calling the helper function in the SQL Query input in the Region tab of the Property Editor:
    SELECT bank_sqlgraph_json('SELECT id_a, id_e, id_b FROM GRAPH_TABLE (bank_sql_pg
      MATCH (a IS accounts) -[e IS transfers]-> (b IS accounts)
        WHERE a.id = 816
        COLUMNS (vertex_id(a) AS id_a, edge_id(e) AS id_e, vertex_id(b) AS id_b)
      )',
      :page_start,
      :page_size
    ) AS result_column FROM DUAL;

    Note that the page_start value is automatcially set. You can set the value of page_size in the Attributes tab of the Property Editor.

8.3 Configure Attributes for the APEX Graph Visualization Plug-in

Learn how to customize your graph visualization using the Graph Visualization plug-in attributes in your APEX application.

You can configure the attributes for the plug-in component in the Attributes tab (Property Editor) on the right pane of the Page Designer.
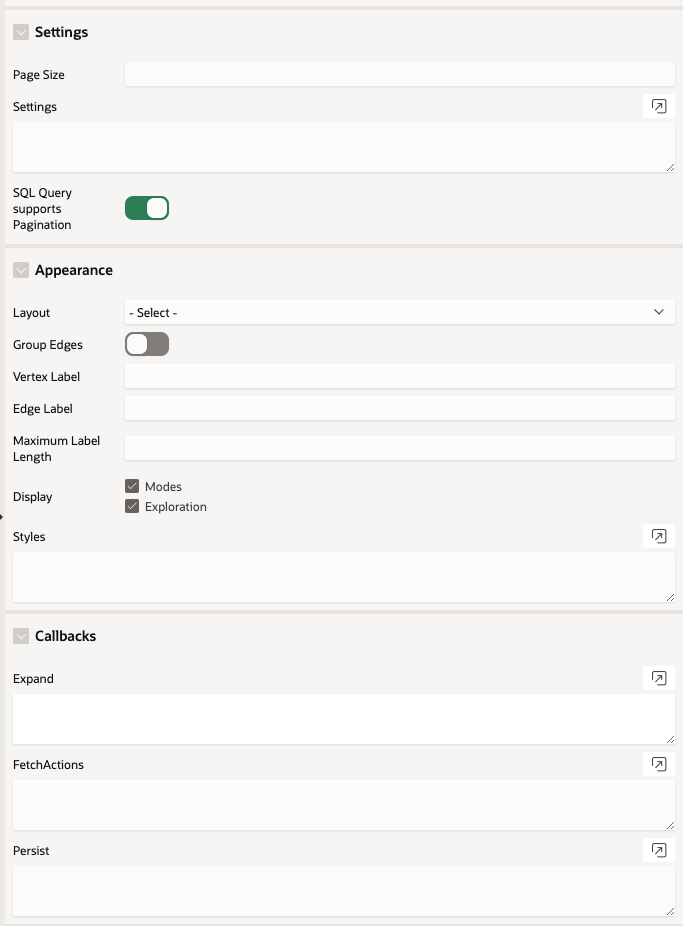
Description of apex_plugin_attr.png follows
Description of the illustration apex_plugin_attr.png

See the Interface page in Graph JavaScript API Reference for Property Graph Visualization which describes the interface mapping for the plugin attributes.

The attributes are grouped as per their scope in the following panels:

Settings

Attribute Description
Page Size Specify the number of vertices and edges to be displayed per page.
Settings Specify the graph settings in JSON format. See Settings for more information.
SQL Query supports Pagination Switch on this toggle if you are implementing the paginate interface.

See Graph Visualization with Pagination for more information.

Appearance

Attribute Description
Layout Specify the graph layout.
Group Edges Switch on this toggle to group edges.
Vertex Label Specify the property to be used for the vertex label.
Edge Label Specify the property to be used for the edge label.
Maximum Label Length Specify the maximum length of the label.
Display Modes Select this checkbox to display the modes panel with the following options:
  • Select:
  • Fit to Screen
  • Toggles Sticky Mode
Display Exploration Select this checkbox to display the following graph exploration actions:
  • Drop - Delete selected vertices
  • Group - Group selected vertices
  • Ungroup - Ungroup selected vertices
  • Undo last action
  • Redo last action
  • Reset the visualization to its default state
Styles Specify the styles configuration in JSON format. See Styles for more information.

Callbacks

Attribute Description
Expand To expand a selected vertex in the graph visualization, see Expand for more information.
FetchActions To retrieve the graph actions from a data source, refer to fetchActions for more information.
Persist To persist the graph actions to a data source, refer to persist for more information.

8.3.1 Settings

You can apply different graph settings such as switching layouts, grouping edges, or showing the evolution of the graph entities based on a property using the Settings attribute in the Property Editor of the Page Designer.

  1. Select the graph visualization component in the Rendering tab on the left pane of the Page Designer.
  2. Select Attributes in the Property Editor on the right pane of the Page Designer.
  3. Enter the input for the desired action in JSON format in the Settings input box in the Settings panel.
    See settings in Oracle Graph JavaScript API Reference for Property Graph Visualization for more information on the Settings interface.

    For instance, the following JSON example provides the layout and pageSize configurations:

    { 
    "pageSize": 10,
    "layout": "concentric"
    }

    Note:

    If the JSON input contains the settings for properties that are already set in the Appearance panel (such as Layout or Group Edges) or Settings panel (Page Size), then the property values that are provided directly will override the JSON values.

    The following JSON example shows a sample configuration for adding network evolution to the graph visualization. The evolution of the graph data is based on the HireDate property:

    {
        "evolution": {
            "chart": "line",
            "unit": "year",
            "vertex": "properties.HireDate"
        }
    }

8.3.2 Styles

You can style a graph using the Styles attribute in the Property Editor of the Page Designer.

  1. Select the graph visualization component in the Rendering tab on the left pane of the Page Designer.
  2. Select Attributes in the Property Editor on the right pane of the Page Designer.
  3. Enter the input for styling in JSON format in the Styles input box.
    See styles in Oracle Graph JavaScript API Reference for Property Graph Visualization for more information on the Style interface.

    The following example shows the JSON input to add a vertex style.

    {
       "vertex":{
          "size":12,
          "label":"${properties.FirstName} ${properties.LastName}",
          "color":"#d5445a",
          "icon":"fa-user"
        }
    }

    Note:

    If the JSON input contains styling for properties that are already set in the Appearance panel (such as Vertex Label, Edge Label, or Maximum Label Length), then the property values that are provided directly will override the JSON values.

8.3.3 Expand

You can expand a selected vertex in the graph and fetch the adjacent vertices using the Expand attribute in the Property Editor of the Page Designer.
  1. Switch to the Processing tab on the left pane of the Page Designer and navigate to the After Submit node.
  2. Right-click and select Create Process from the context menu.
  3. Enter the process Name.
  4. Specify Type as Execute Code.
  5. Select the source Location as Local Database.
  6. Select the source Language as PL/SQL and enter the following code in the PL/SQL input box.
    DECLARE data clob;
        id VARCHAR2(100) := apex_application.g_x01;
        graph VARCHAR2(100) := '<graph_name>';
        hops NUMBER := <no_of_hops>;
        n NUMBER := hops - 1;
        match_clause VARCHAR2(100);
        query VARCHAR2(1000);
    
    BEGIN
        IF n = 0 THEN
            match_clause := ' MATCH (x) -[e]-> (z) ';
        ELSE
            match_clause := ' MATCH (x) ->{,' || n || '} (y) -[e]-> (z) ';
        END IF;
    
        query := 'SELECT id_x, id_e, id_z
                  FROM GRAPH_TABLE (' || graph ||  match_clause  || 
                  'WHERE JSON_value(vertex_id(x), ''$.ELEM_TABLE'') || json_query(vertex_id(x), ''$.KEY_VALUE'' returning varchar2) = '''|| id ||'''
                  COLUMNS (vertex_id(x) as id_x, edge_id(e) as id_e, vertex_id(z) as id_z))';
        SELECT <helper_function>(query) INTO data FROM sys.dual;
        htp.p(data);
    END;

    In the preceding code:

    • <graph_name>: Name of the graph
    • <hops>: Number of hops to be expanded
    • <helper_function>: Name of the function that provides the CURSOR for the SQL graph query as input to the ORA_SQLGRAPH_TO_JSON function and obtains the JSON output for visualization.
    Note that the process takes the vertex id to be expanded as input and returns the resulting output as JSON.
  7. Select the execution Point as Ajax Callback.
  8. Switch to the Rendering tab on the left pane of the Page Designer and select the graph visualization component.
  9. Switch to the Attributes tab on the right pane and enter the following code in the Expand input box in the Callbacks panel.
    const data = await apex.server.process('<process_name>', {
        x01: ids[0]
    }, { dataType: 'text' });
    try {
        return JSON.parse(data);
    } catch (error) {
        return [];
    }

    In the preceding code, <process_name> refers to the name of process that was provided at step-3.

  10. Click Save.
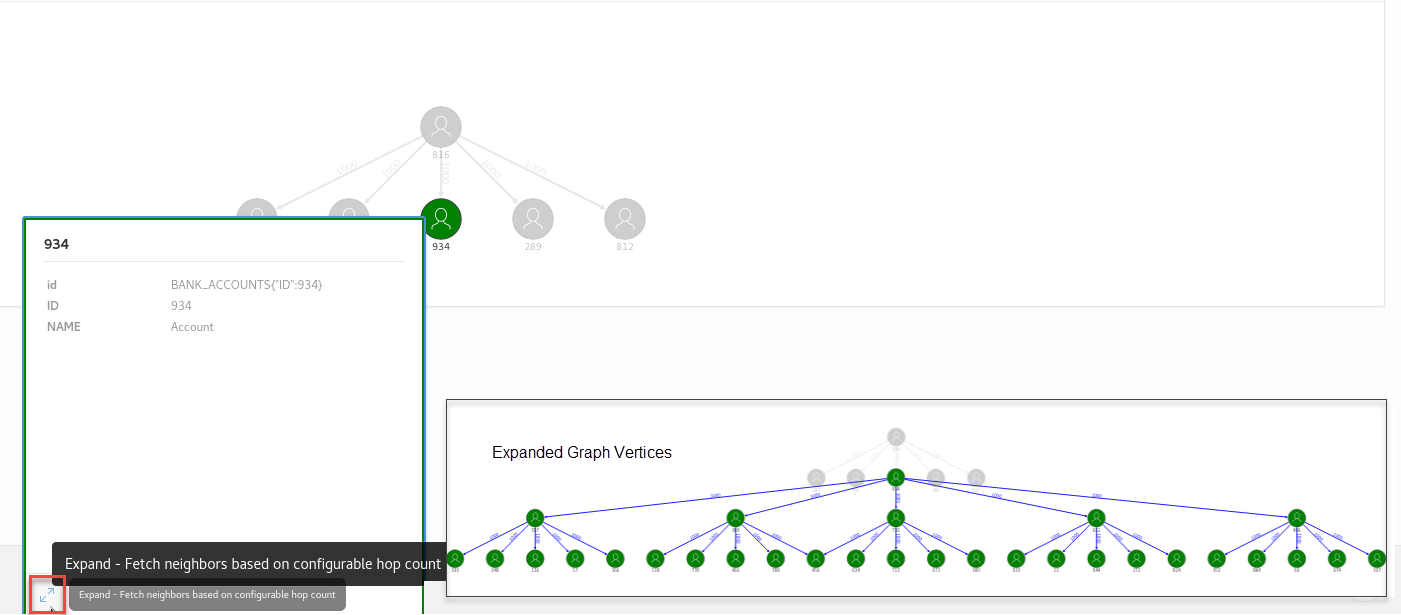
  11. Run the application page and you can now click expand (as shown highlighted in the following figure) on any specific vertex in the graph.

    Figure 8-3 Expanding on a Specific Graph Vertex

    Description of Figure 8-3 follows
    Description of "Figure 8-3 Expanding on a Specific Graph Vertex"

    The inset image in the preceding figure shows the graph with expanded vertices as rendered by the plug-in.