3 Introduction to SQL Property Graphs

You can work with SQL property graphs in any SQL based interface (such as SQL Developer, SQLPLUS, or SQLcl) or from a Java program using JDBC.

Using SQL statements, you can perform the following:

  • Create a SQL property graph from existing database objects in your schema, such as:
  • Create a synonym for a SQL property graph.
  • Revalidate a SQL property graph.
  • Run graph pattern matching queries on a SQL property graph.
  • Drop a SQL property graph.

For example, the following figure shows the creation of a SQL property graph using the SQL Developer tool.

Figure 3-1 Using SQL Developer to Create a SQL Property Graph
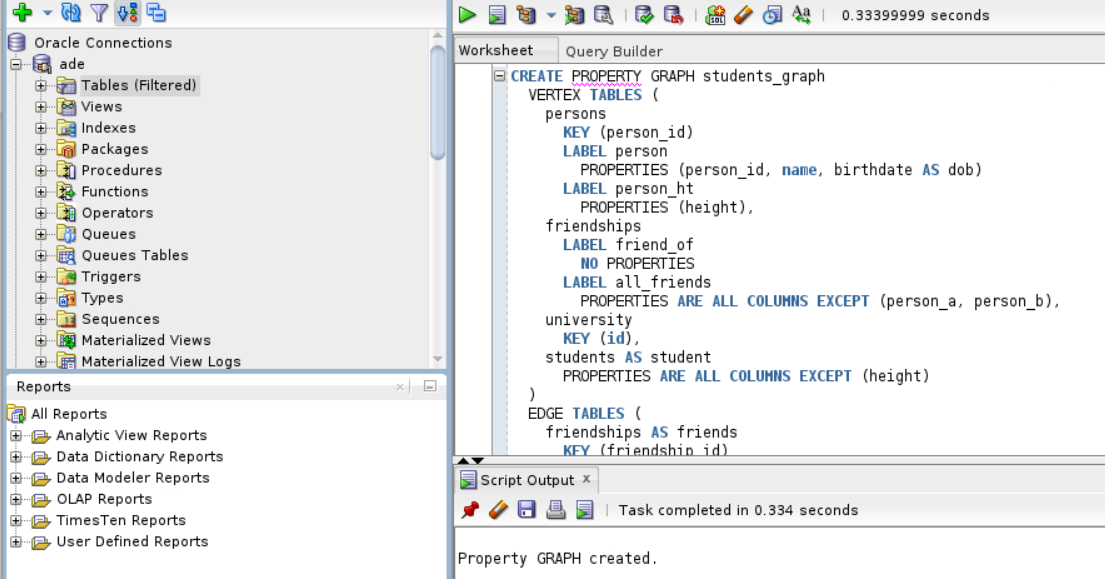
Description of Figure 3-1 follows
Description of "Figure 3-1 Using SQL Developer to Create a SQL Property Graph"

3.1 Quick Start for Working with SQL Property Graphs

This tutorial helps you get started on creating, querying, and running graph algorithms on a SQL property graph.

In order to try this tutorial, ensure that you meet the following requirements:

In the following tutorial, the examples in Step 1, Step 2, and Step 7 are performed using the SQLcl tool. However, you can run these examples using any SQL based interface.
  1. Create a SQL property graph using the CREATE PROPERTY GRAPH DDL statement.
    SQL> CREATE PROPERTY GRAPH bank_sql_pg
      2    VERTEX TABLES (
      3      bank_accounts
      4      KEY (id)
      5      LABEL account
      6      PROPERTIES ALL COLUMNS
      7    )
      8    EDGE TABLES (
      9      bank_txns
     10        KEY (txn_id)
     11        SOURCE KEY (from_acct_id) REFERENCES bank_accounts (id)
     12        DESTINATION KEY (to_acct_id) REFERENCES bank_accounts (id)
     13        LABEL transfer
     14        PROPERTIES ALL COLUMNS
     15*   );
    
    Property created.

    On execution, the bank_sql_pg graph is created in the database. The graph is made up of one vertex graph element table (bank_accounts) and one edge graph element table (bank_txns).

    See Creating a SQL Property Graph to learn the concepts of graph element tables, keys, labels and properties.

  2. Run a SQL graph query, on the newly created graph, to list all the transactions from the account with id value 816.
    SQL> SELECT * FROM GRAPH_TABLE (bank_sql_pg
      2    MATCH
      3    (a IS account WHERE a.id = 816) -[e IS transfer]-> (b IS account)
      4    COLUMNS (a.id AS acc_a, e.amount AS amount, b.id AS acc_b)
      5* );
    
       ACC_A    AMOUNT    ACC_B
    ________ _________ ________
         816      4713      287
         816      8001      590
         816      4186      934
         816      3718      289
         816      4039      812

    See SQL Graph Queries for more information.

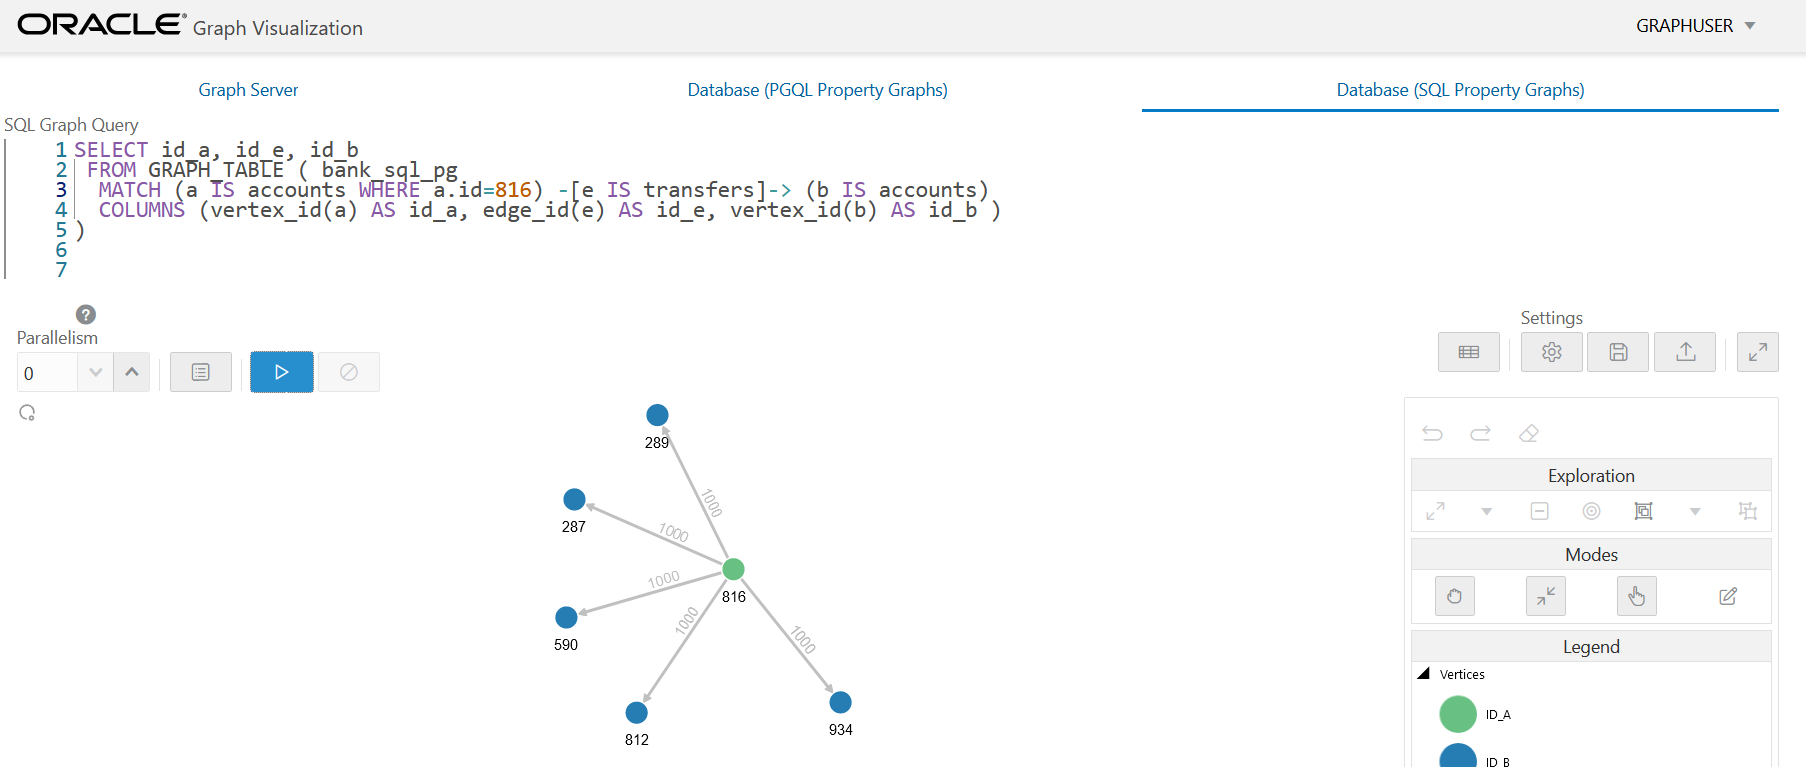
  3. Optionally, if you have installed the graph server (PGX), then you can also visualize the preceding SQL graph query, using the graph visualization tool.

    The only difference is that you must return the vertex and edge IDs in order to visualize the vertices and edges of the SQL graph query together with their IDs and all their labels and properties. Note that the COLUMNS clause in the following example uses the VERTEX_ID and EDGE_ID operators:

    Figure 3-2 Visualizing a SQL Graph Query

    Description of Figure 3-2 follows
    Description of "Figure 3-2 Visualizing a SQL Graph Query"
  4. Load the graph into the graph server (PGX) if you want to run graph algorithms.
    opg4j> var graph = session.readGraphByName("BANK_SQL_PG", GraphSource.PG_SQL)
    graph ==> PgxGraph[name=BANK_SQL_PG,N=1000,E=5001,created=1681020302077]
    PgxGraph graph = session.readGraphByName("BANK_SQL_PG", GraphSource.PG_SQL);
    >>> graph = session.read_graph_by_name("BANK_SQL_PG", "pg_sql")
    >>> graph
    PgxGraph(name: BANK_SQL_PG, v: 1000, e: 5001, directed: True, memory(Mb): 0)
  5. Execute the PageRank algorithm as shown:
    opg4j> var analyst = session.createAnalyst()
    analyst ==> NamedArgumentAnalyst[session=0fb6bea7-d467-458d-90c3-803d2932df12]
    opg4j> analyst.pagerank(graph)
    $3 ==> VertexProperty[name=pagerank,type=double,graph=BANK_SQL_PG]
    Analyst analyst = session.createAnalyst();
    analyst.pagerank(graph);
    >>> analyst = session.create_analyst()
    >>> analyst.pagerank(graph)
    VertexProperty(name: pagerank, type: double, graph: BANK_SQL_PG)
  6. Query the graph to list the top 10 accounts by pagerank:
    opg4j> session.queryPgql("SELECT a.id, a.pagerank FROM MATCH (a) ON BANK_SQL_PG ORDER BY a.pagerank DESC LIMIT 5").print()
    +-----------------------------+
    | id  | pagerank              |
    +-----------------------------+
    | 387 | 0.007302836252205924  |
    | 406 | 0.006734430614559079  |
    | 135 | 0.006725965475577353  |
    | 934 | 0.006641340764834484  |
    | 397 | 0.0057016075312134595 |
    +-----------------------------+
    $5 ==> PgqlResultSetImpl[graph=BANK_SQL_PG,numResults=5]
    session.queryPgql("SELECT a.id, a.pagerank FROM MATCH (a) ON BANK_SQL_PG ORDER BY a.pagerank DESC LIMIT 5").print();
    >>> session.query_pgql("SELECT a.id, a.pagerank FROM MATCH (a) ON BANK_SQL_PG ORDER BY a.pagerank DESC LIMIT 5").print()
    +-----------------------------+
    | id  | pagerank              |
    +-----------------------------+
    | 387 | 0.007302836252205924  |
    | 406 | 0.006734430614559079  |
    | 135 | 0.006725965475577353  |
    | 934 | 0.006641340764834484  |
    | 397 | 0.0057016075312134595 |
    +-----------------------------+
  7. Drop the SQL property graph after running the graph queries.
    SQL> DROP PROPERTY GRAPH bank_sql_pg;
    
    Property dropped.