16.1.1 Memory Usage
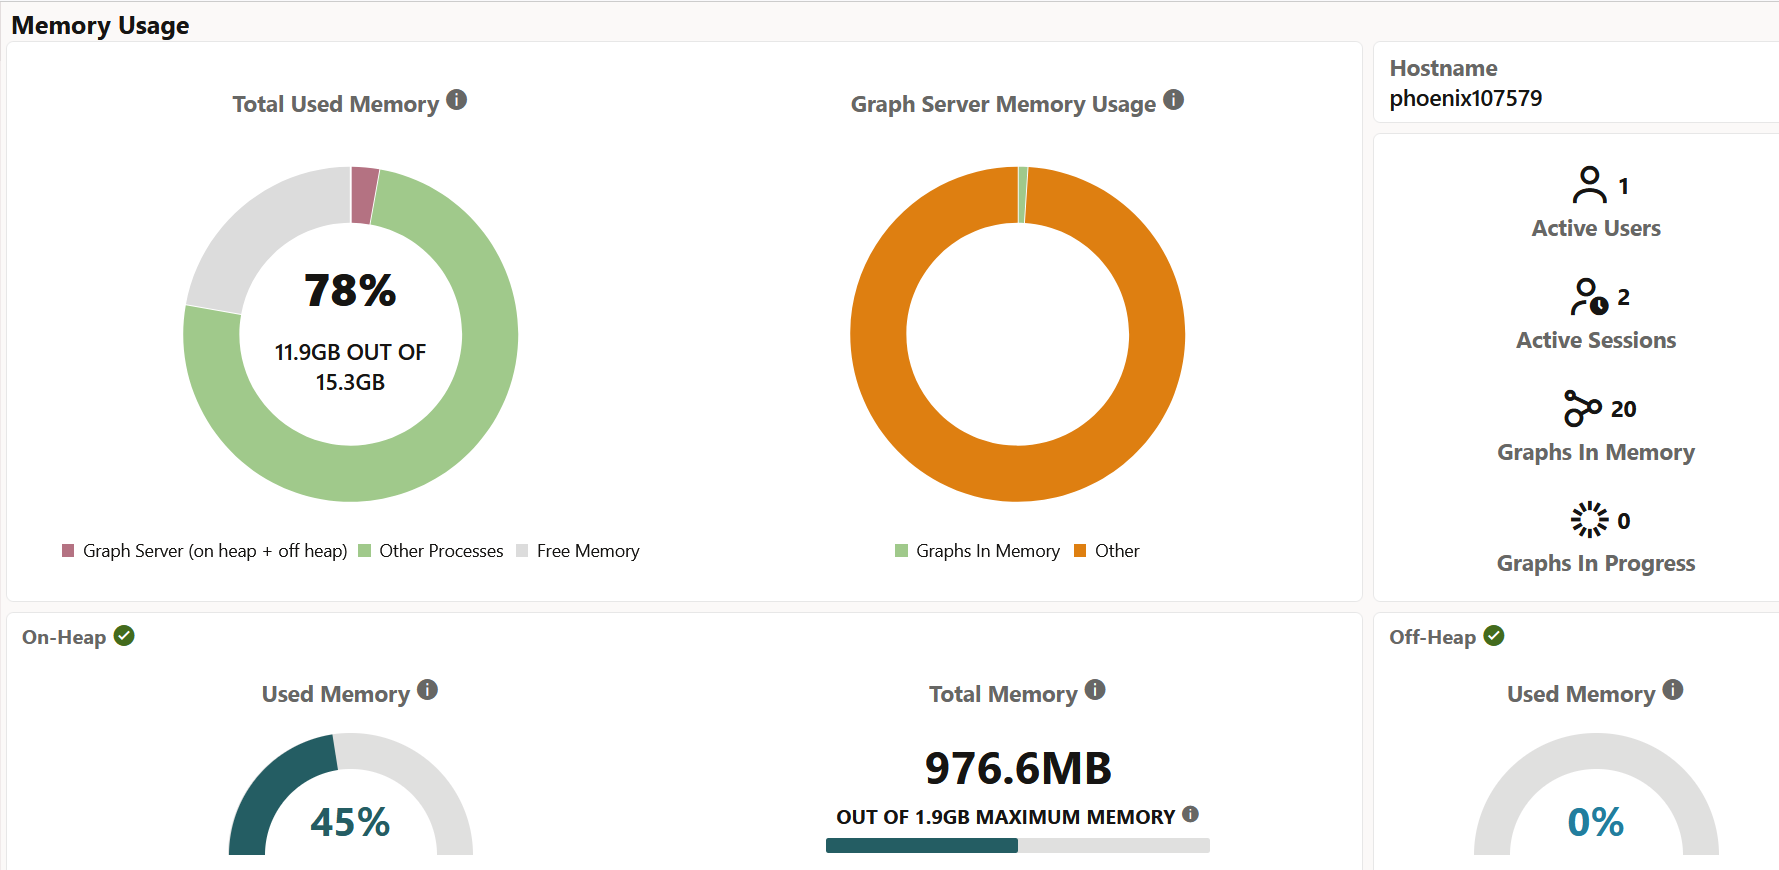
The Memory Usage dashboard provides in-depth information on the amount of memory used by the graph server (PGX).
The dashboard comprises the following sections:
- Total Used Memory: This chart displays the total memory usage at the system level. It shows the memory consumption by the graph server (sum of on-heap and off-heap memory) and other processes. You can also view the available amount of free memory.
- Graph Server Memory Usage: This chart displays the memory consumed by graphs that are loaded into the graph server and also the memory usage for other graph operations such as loading graphs, running graph algorithms and so on.
- On-Heap: This section provides the following
details:
- Used Memory: This displays the on-heap memory used currently by the graph server out of the total heap size that is dynamically allocated by the JVM.
- Total Memory: This displays the total (determined by the -Xms flag) and maximum heap size (determined by the -Xmx flag) allocated by the JVM.
- Off-heap: This displays the off-heap memory used currently by the graph server.
- Hostname: Graph server hostname
-
- Active Users: Number of active users
- Active Sessions: Number of active sessions
- Graphs In Memory: Number of graphs loaded in to memory
- Graphs in Progress: Number of graphs that are being loaded into memory
Parent topic: Using the Graph Server Administrator Dashboard
