23.6 Graph Visualization Settings
You can click the Settings gear icon to open the Graph Visualization settings window.
The Visualization settings window comprises the General, Graph Exploration, and Styles tab.
Configuring General Settings
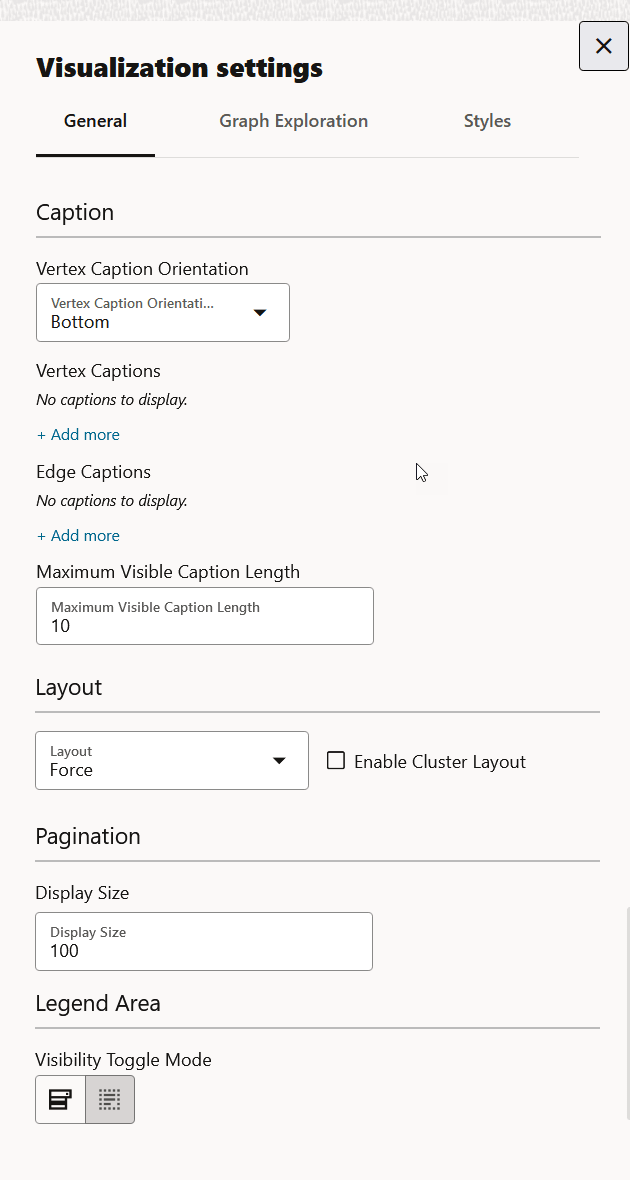
You can add vertex and edge captions, set the graph layout and page size in the General of the Graph Visualization settings:
- Vertex Caption Orientation: Determines where the selected vertex property will be displayed.
- Vertex Caption: Determines the property to be displayed for
a vertex.
Click + Add more to add a vertex caption and select the required vertex Label and vertex Property.
- Edge Caption: Determines the property to be displayed for an
edge.
Click + Add more to add an edge caption and select the required edge Label and edge Property.
- Maximum Visible Caption Length: Maximum caption length before truncating.
- Layout: Computes the position of the nodes and determines the
visual structure of the graph.
Supported layouts are: Circle, Concentric, Force (default), Grid, Hierarchical, Preset, Radial, Random, and Geographical.
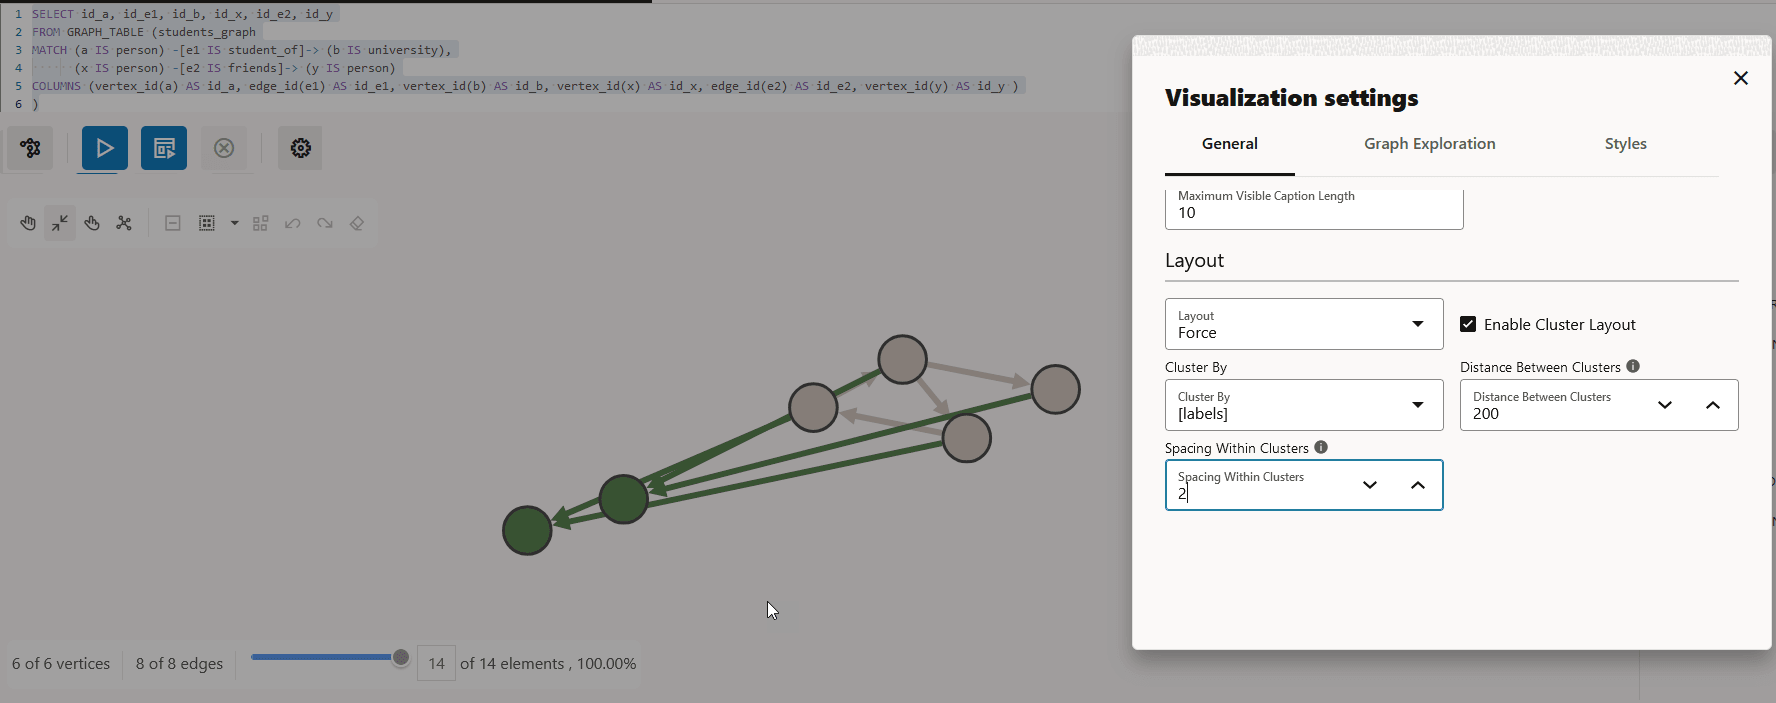
The Force layout also supports a clustering option, which allows you to visualize a graph with clustered vertices. See Enabling Cluster Option in Graph Visualization for more information.
- Display Size: Determines the number of graph elements to be visualized on a page from the result set.
- Visibility Toggle Mode: Enables you to
customize the visibility toggle behaviour of the legend items through
settings:
- Enable hide when any unchecked: Vertex and edge elements will be hidden when one of the legend items that affect them has its visibility turned off.
- Enable hide when all unchecked: Vertex and edge elements will only be hidden when all the legend items that affect them have their visibility turned off.
Configuring Graph Exploration Settings
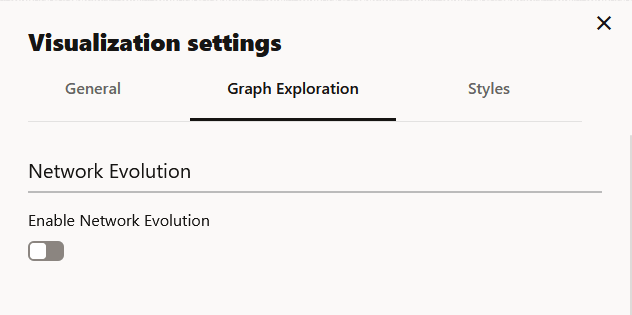
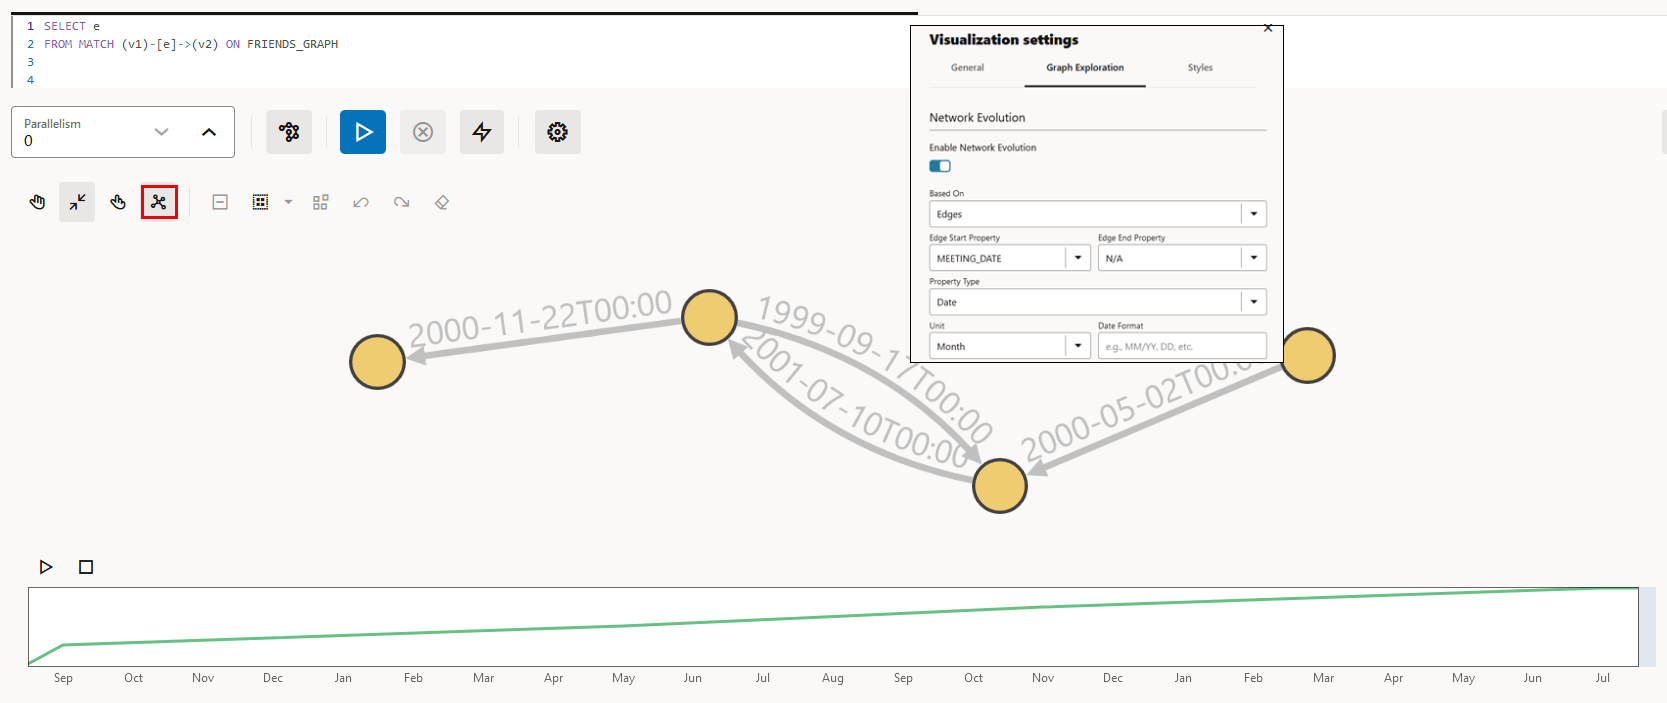
You can enable and configure Network Evolution in the Graph Exploration tab of the Graph Visualization settings. See Using Network Evolution in Graph Visualization for more information.
Figure 23-22 Graph Exploration Tab Configuration
Configuring Vertex and Edge Styles
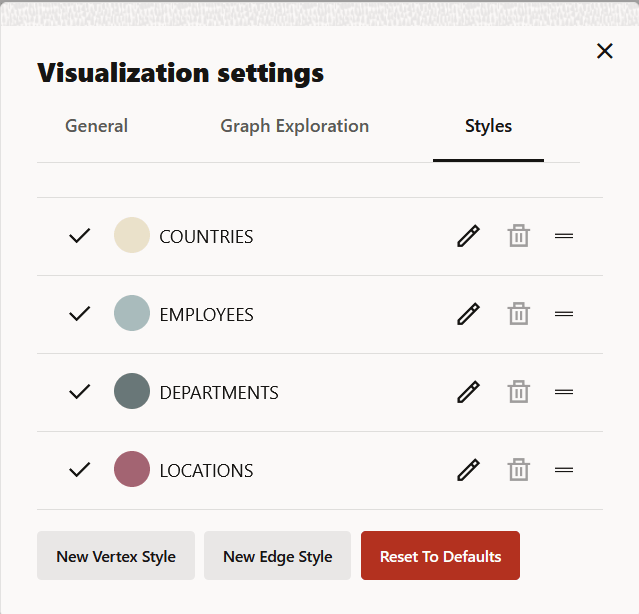
You can configure and manage vertex and edge styles to customize the appearance of vertices and edges in the graph. The Styles tab of the Graph Visualization settings displays both the default and custom vertex and edge styles.
You can perform the following actions in this tab:
- Add a new custom vertex style.
- Add a new custom edge style.
- Edit the default styling of a vertex or an edge element.
- Edit or delete the custom styling of a vertex or an edge element.
- Restore the default style settings.
Figure 23-23 Vertex and Edge Styles Configuration
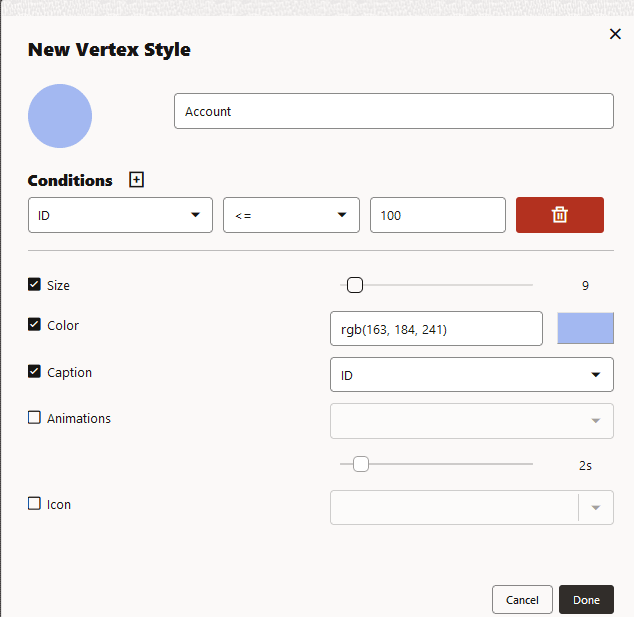
To add a new vertex or edge style, click New vertex style or New edge style as appropriate and configure the following values:
- Name: Name of the style
- Conditions: Click + to add a condition
for an element (vertex or edge) and provide the following values:
- Property of the vertex or edge element.
- Operator to be applied. The
following operators are supported:
=(equal to)<(less than)<=(less than or equal to)>(greater than)>=(greater than or equal to)!=(not equal to)~(filter is a regular expression)*(any: like a wildcard, can match to anything)
- Value that needs to be fulfilled for the property and the operator
You can add as many conditions as required. For all elements that meet the conditions, you can configure any of the following styling highlights:
- Size: Size of the vertex or edge
- Color: Color of the vertex or edge
- Caption: Caption for the vertex or edge
- Animations: Animation (Pulsating or Flashing) and duration of the animation cycle
- Icon: Image for the vertex (does not apply for edges)
The following example shows a sample vertex style configuration.
- Enabling Cluster Option in Graph Visualization
You can enable the cluster option with Force layout to group vertices by labels or by any specific vertex property in your graph visualization. - Using the Geographical Layout
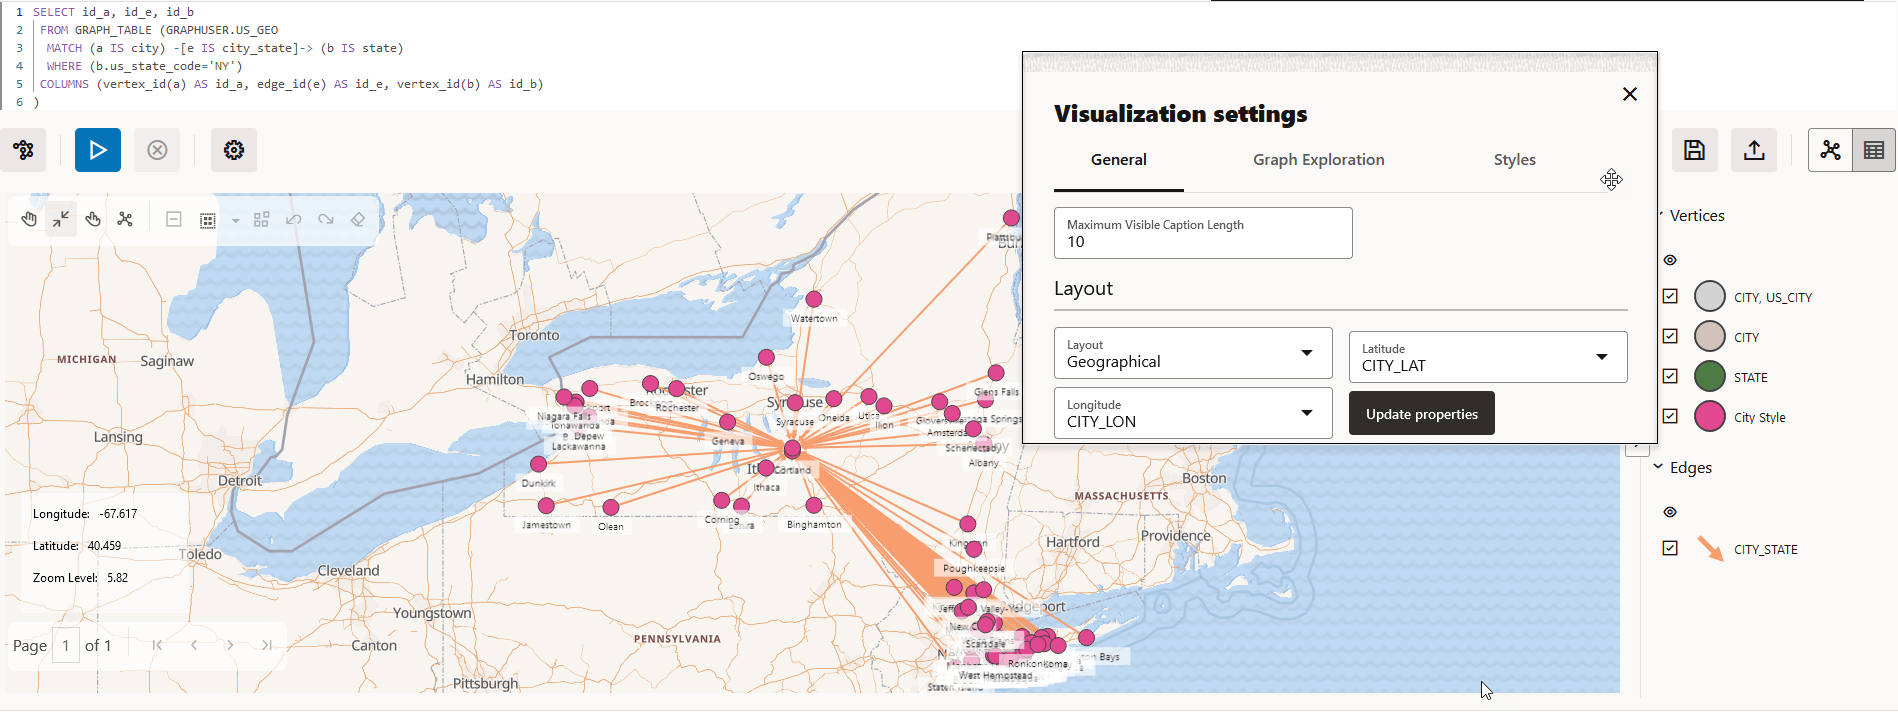
You can use the Geographical layout to show the graph (vertices and edges) on a global map in the Graph Visualization application. - Using Network Evolution in Graph Visualization
You can visualize the evolution of a graph over time using the Network Evolution feature in the Graph Visualization application. - Importing and Exporting Graph Visualization Settings
You can import and export the graph visualization settings as a JSON file.
Parent topic: Using the Graph Visualization Application
23.6.1 Enabling Cluster Option in Graph Visualization
You can enable the cluster option with Force layout to group vertices by labels or by any specific vertex property in your graph visualization.
Perform the following steps to apply clustering of vertices in your graph visualization:
Parent topic: Graph Visualization Settings
23.6.2 Using the Geographical Layout
You can use the Geographical layout to show the graph (vertices and edges) on a global map in the Graph Visualization application.
In order to view your vertices on a map, they must include a geographical location,
in the form of a pair of properties that contain the longitude and latitude
coordinates for that vertex. You can use any name for the longitude and latitude
properties (such as X and Y, or
long and lat). For example:
US_CITY                CITY_LAT   CITY_LON
-------------------- ---------- ----------
Binghamton              42.1014   -75.9093
Utica                   43.0961    -75.226
New Rochelle            40.9305   -73.7836
Saratoga Springs        43.0674   -73.7775
New York                40.6943   -73.9249
However, you must ensure that the longitude and latitude pair are in the WGS84 system (GPS coordinates), and the coordinates are expressed in decimal degrees.
Perform the following steps to apply geographical layout:
Parent topic: Graph Visualization Settings
23.6.3 Using Network Evolution in Graph Visualization
You can visualize the evolution of a graph over time using the Network Evolution feature in the Graph Visualization application.
In order to visualize a dynamic graph, it is important that the graph contains date or time properties. It can either be a vertex or an edge property.
Perform the following steps for configuring network evolution:
Parent topic: Graph Visualization Settings
23.6.4 Importing and Exporting Graph Visualization Settings
You can import and export the graph visualization settings as a JSON file.
Figure 23-28 Importing and Exporting Settings
Parent topic: Graph Visualization Settings
