23.1 Visualizing Graph Queries on SQL Property Graphs
You can query and visualize a SQL property graph in the database in the Database (SQL Property Graphs) tab of the Graph Visualization application.
However, in order to visualize the vertices and edges of a
GRAPH_TABLE query together with their IDs and all their labels and
properties, the query must return the vertex ID, or edge ID, or both.
For example, the following figure shows the visualization of a SQL
GRAPH_TABLE query on a SQL property graph. Note that the
COLUMNS clause in the query uses the VERTEX_ID and
EDGE_ID functions.
Note:
The Graph Visualization application supports onlySELECT graph queries.
Figure 23-3 Graph Query on a SQL Property Graph

Description of "Figure 23-3 Graph Query on a SQL Property Graph"
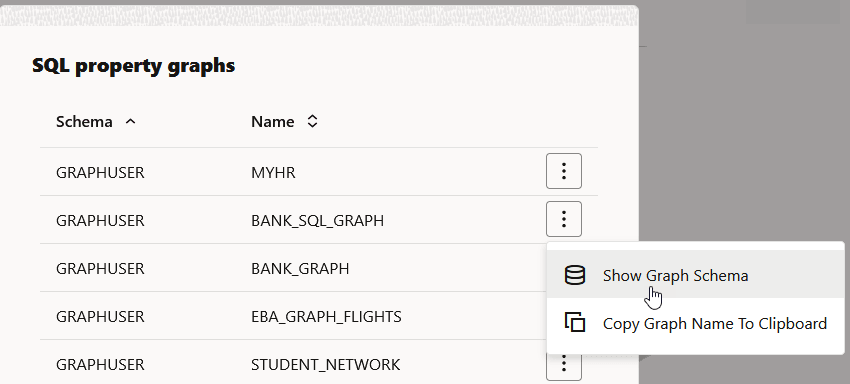
The name of the graph must be provided in the SQL graph query. You can click the List of available graphs icon (shown highlighted in the preceding figure) to view the list of SQL property graphs to which you have access.
- Visualizing the Schema of a SQL Property Graph
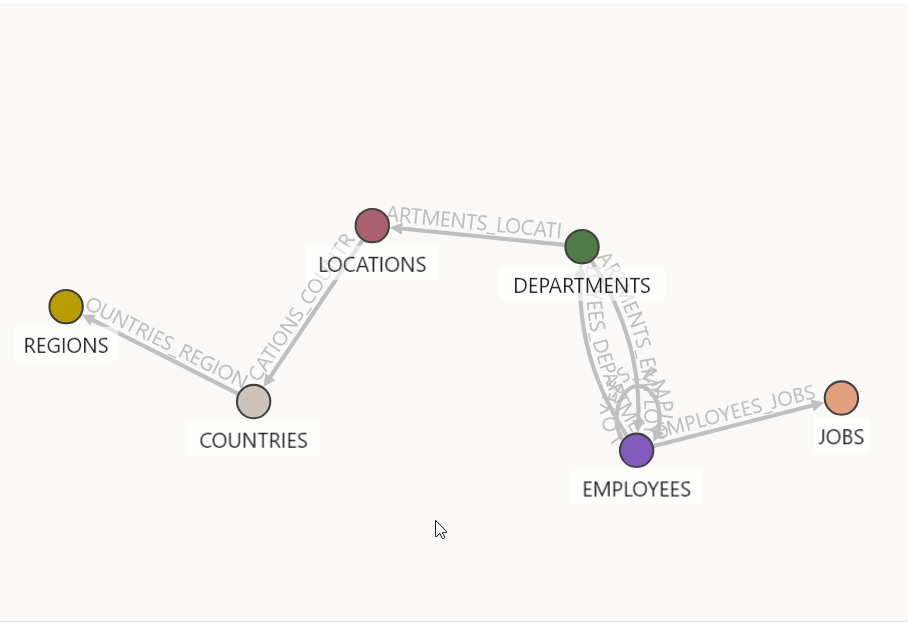
Starting from Graph Server and Client Release 25.3, you can visualize the underlying schema of a SQL property graph.
See Also:
SQL Graph Queries for more informationParent topic: Using the Graph Visualization Application
23.1.1 Visualizing the Schema of a SQL Property Graph
Starting from Graph Server and Client Release 25.3, you can visualize the underlying schema of a SQL property graph.
Perform the following steps to visualize the schema of a SQL property graph.
Parent topic: Visualizing Graph Queries on SQL Property Graphs

