Interpolation
Interpolation can be applied to the size or color of the vertices or edges. The following interpolation types are supported:
- Linear Interpolation
- Discrete Interpolation
- Color Interpolation
Linear Interpolation
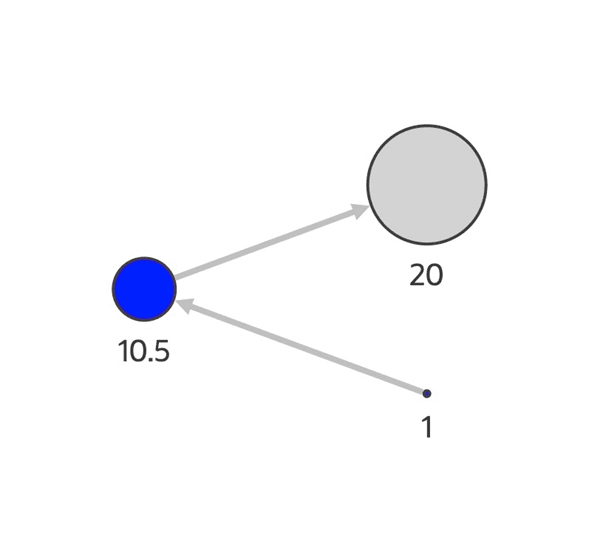
The default linear interpolation can be used to define the size of nodes or edges within a range using a property value to interpolate in the given range.
Consider the following example:
// This import is not necessary if you are using Oracle JET.
import '@ovis/graph/alta.css';
import Visualization from '@gvt/graphviz';

const vertices = [
  {
    id: 1,
    properties: {
      label: 'blue',
      name: 'Hello',
      age: 10
    }
  },
  {
    id: 2,
    properties: {
      label: 'blue',
      name: 'World',
      age: 20
    }
  },
  {
    id: 3,
    properties: {
      name: 'Some Name',
      age: 30
    }
  }
];

const edges = [
  {
    id: 1,
    source: 1,
    target: 2
  },
  {
    id: 2,
    source: 2,
    target: 3
  }
];

const settings = {
  ruleBasedStyles: [{
    component: 'vertex',
    target: 'vertex',
    stylingEnabled: true,
    conditions: {
      conditions: [{
        property: "label",
        operator: "=",
        value: "blue"
      }]
    },
    style: { color: 'blue' }
  }],
  baseStyles: {
    vertex: {
      // The label is changed to see the size of the node on it.
      label: { text: '${interpolate("properties.age", 1, 20)}' },
      // The size will be defined by the interpolation of properties.age in the range of 1 -> 20.
      size: '${interpolate("properties.age", 1, 20)}'
    }
  }
};

new GraphVisualization({
  target: document.body,
  props: { data: { vertices, edges }, settings}
});
The corresponding visualization appears as shown:
Figure: Normal Linear Interpolation
Description of the illustration linear_interpolation.png
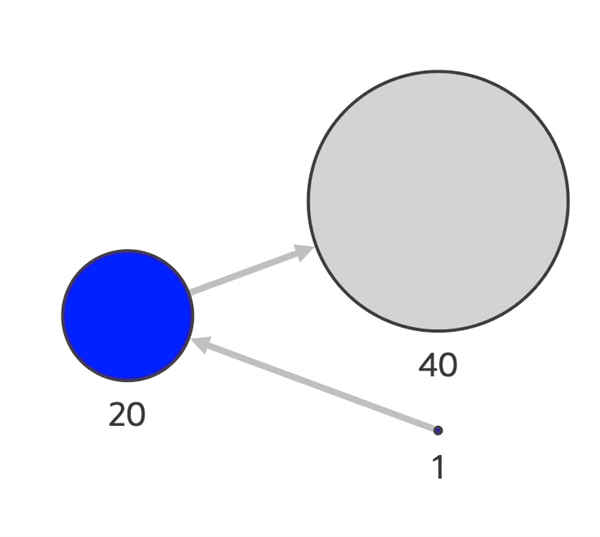
Alternatively, you can also use multiple values for interpolation instead of just using one range.
// This import is not necessary if you are using Oracle JET.
import '@ovis/graph/alta.css';
import Visualization from '@gvt/graphviz';

const vertices = [
  {
    id: 1,
    properties: {
      label: 'blue',
      name: 'Hello',
      age: 10
    }
  },
  {
    id: 2,
    properties: {
      label: 'blue',
      name: 'World',
      age: 20
    }
  },
  {
    id: 3,
    properties: {
      name: 'Some Name',
      age: 30
    }
  }
];

const edges = [
  {
    id: 1,
    source: 1,
    target: 2
  },
  {
    id: 2,
    source: 2,
    target: 3
  }
];

const settings = {
  ruleBasedStyles: [{
    component: 'vertex',
    target: 'vertex',
    stylingEnabled: true,
    conditions: {
      operator: 'and',
      conditions: [{
        property: "label",
        operator: "=",
        value: "blue"
      }]
    },
    style: { color: 'blue' }
  }],
  baseStyles: {
    vertex: {
      // The label is changed to see the size of the node on it.
      label: { text: '${interpolate("properties.age", 1, 20, 40)}' },
      // The size will be defined by the interpolation of properties.age using the values of 1, 20, 40.
      size: '${interpolate("properties.age", 1, 20, 40)}'
    }
  }
};

new GraphVisualization({
  target: document.body,
  props: { data: { vertices, edges }, settings}
});
The visualization for the preceding settings appear as shown:
Figure: Linear Interpolation for a Range of Values
Description of the illustration multi_interpolation_usage.png
Discrete Interpolation
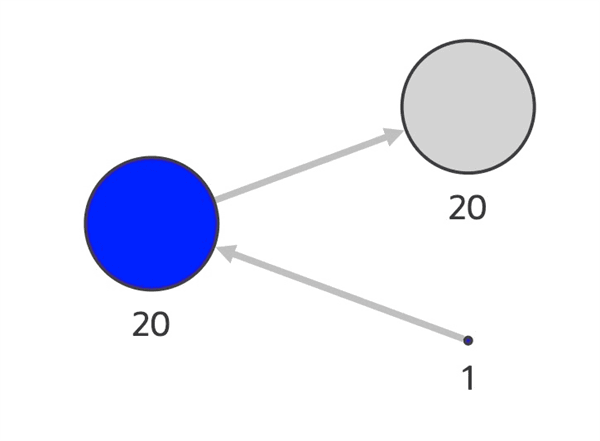
Discrete interpolation can be used to define the size of vertices or edges within a defined range using a property as the value to interpolate in the given range. Unlike linear interpolation, the resulting values can only be the exact start or end value of the range. If the property value falls in the first half between the minimum and maximum values, it will be rounded up; otherwise, it will be rounded down.
Consider the following example:
// This import is not necessary if you are using Oracle JET.
import '@ovis/graph/alta.css';
import Visualization from '@gvt/graphviz';

const vertices = [
  {
    id: 1,
    properties: {
      label: 'blue',
      name: 'Hello',
      age: 10
    }
  },
  {
    id: 2,
    properties: {
      label: 'blue',
      name: 'World',
      age: 20
    }
  },
  {
    id: 3,
    properties: {
      name: 'Some Name',
      age: 30
    }
  }
];

const edges = [
  {
    id: 1,
    source: 1,
    target: 2
  },
  {
    id: 2,
    source: 2,
    target: 3
  }
];

const settings = {
  ruleBasedStyles: [{
    component: 'vertex',
    target: 'vertex',
    stylingEnabled: true,
    conditions: {
      conditions: [{
        property: "label",
        operator: "=",
        value: "blue"
      }]
    },
    style: { color: 'blue' }
  }],
  baseStyles: {
    vertex: {
      // The label is changed to see the size of the node on it.
      label: { text: '${interpolate.discrete("properties.age", 1, 20)}' },
      // The size will be defined by the interpolation of properties.age in the range of 1 -> 20.
      // In this example since the node with age 20 is exactly in the middle, it will be rounded up to 20.
      size: '${interpolate.discrete("properties.age", 1, 20)}'
    }
  }
};

new GraphVisualization({
  target: document.body,
  props: { data: { vertices, edges }, settings}
});
The corresponding graph visualization is as shown:
Figure: Discrete Interpolation
Description of the illustration discrete_interpolation_usage.png
Discrete interpolation can also be applied using colors. You only need to define the colors that are to be discretely interpolated.
Consider the following example:
// This import is not necessary if you are using Oracle JET.
import '@ovis/graph/alta.css';
import Visualization from '@gvt/graphviz';

const vertices = [
  {
    id: 1,
    properties: {
      label: 'blue',
      name: 'Hello',
      age: 10
    }
  },
  {
    id: 2,
    properties: {
      label: 'blue',
      name: 'World',
      age: 20
    }
  },
  {
    id: 3,
    properties: {
      name: 'Some Name',
      age: 30
    }
  }
];

const edges = [
  {
    id: 1,
    source: 1,
    target: 2
  },
  {
    id: 2,
    source: 2,
    target: 3
  }
];

const settings = {
  baseStyles: {
    vertex: {
      label: { text: '${interpolate.discrete("properties.age", "black", "white")}' },
      color: '${interpolate.discrete("properties.age", "black", "white")}'
    }
  }
};

new GraphVisualization({
  target: document.body,
  props: { data: { vertices, edges }, settings }
});
The corresponding visualization appears as shown:
Figure: Discrete Interpolation Using Colors

Description of the illustration discrete_color_usage.png
Color Interpolation
Colors can also be linearly interpolated using the interpolate.color function. You need to define the colors to interpolate the desired property.
Consider the following example:
// This import is not necessary if you are using Oracle JET.
import '@ovis/graph/alta.css';
import Visualization from '@gvt/graphviz';

const vertices = [
  {
    id: 1,
    properties: {
      label: 'blue',
      name: 'Hello',
      age: 10
    }
  },
  {
    id: 2,
    properties: {
      label: 'blue',
      name: 'World',
      age: 20
    }
  },
  {
    id: 3,
    properties: {
      name: 'Some Name',
      age: 30
    }
  }
];

const edges = [
  {
    id: 1,
    source: 1,
    target: 2
  },
  {
    id: 2,
    source: 2,
    target: 3
  }
];

const settings = {
  baseStyles: {
    vertex: {
      label: { text: '${properties.age}' },
      color: '${interpolate.color("properties.age", "black", "white")}'
    }
  }
};

new GraphVisualization({
  target: document.body,
  props: { data: { vertices, edges }, settings }
});
The corresponding visualization appears as shown:
Figure: Color Interpolation
