Layouts
The Graph Visualization library supports several graph layouts. Each layout has its own algorithm, which computes the placements of the vertices and edges, affecting the visual structure of the graph.
You can configure these layouts through the settings option as shown:
Settings:
{
  ...
  layout: <'circle', 'concentric', 'force', 'grid', 'hierarchical', 'preset', 'radial', 'random', 'geographical'>
  ...
}
In addition, you can create custom layouts by passing the layout specific options using the settings format as shown:
Settings:
{
  ...
  layout: {
    type: 'grid',
    spacing: 5
  }
  ...
}
The following describes the supported layouts in graph visualization.
-
Circle Layout The circle layout positions the graph vertices in a circle.
-
Concentric Layout The concentric layout positions the graph vertices in concentric circles.
-
Force Layout The force layout aims to create a visually appealing graph. It positions the graph vertices in the viewport so that all the edges are approximately equal in length and minimizes crossings between the edges.
-
Geographical Layout The geographical layout allows you to overlay the graph on a map.
-
Grid Layout The grid layout positions the graph vertices in a well-spaced grid.
-
Hierarchical Layout The hierarchical layout organizes the graph using Directed Acyclic Graph (DAG) system. It is especially suitable for DAGs and trees.
-
Radial Layout The radial layout displays the dependency chain of a graph by using an outwards expanding tree structure. It can be especially useful if the graph data has a hierarchical structure and contains many children for each parent vertex.
-
Random Layout The random layout puts the graph vertices in random positions within the viewport.
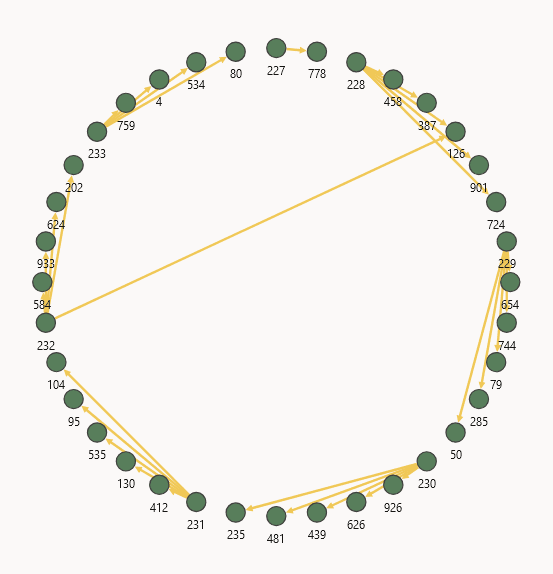
Circle Layout
The circle layout positions the graph vertices in a circle.
Figure: Circle Layout
Description of the illustration circle_layout.png
You can configure the spacing property to set the the radius of the circle.
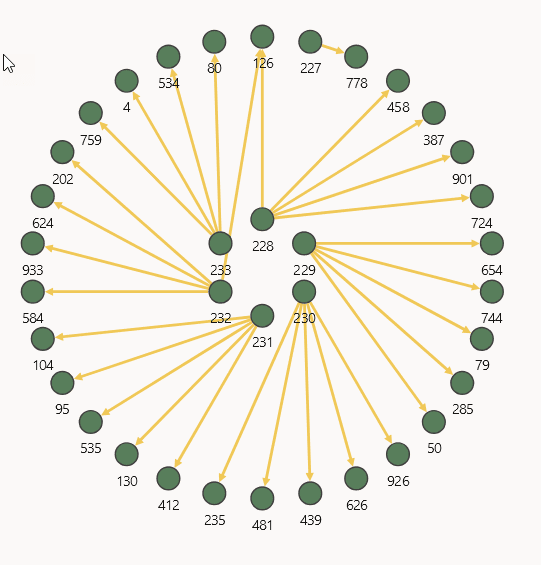
Concentric Layout
The concentric layout positions the graph vertices in concentric circles.
Figure: Concentric Layout
Description of the illustration concentric_layout.png
You can configure the spacing property to set the minimum spacing between the vertices. It is basically used for adjusting the radius of the concentric circles.
Force Layout
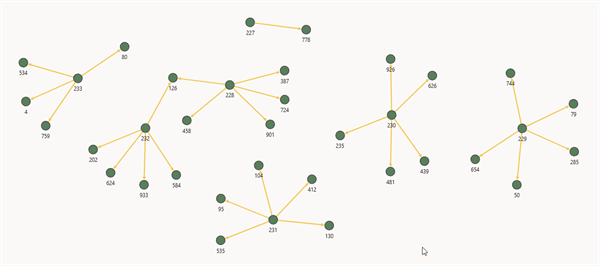
The force layout aims to create a visually appealing graph. It positions the graph vertices in the viewport so that all the edges are approximately equal in length and minimizes crossings between the edges.
The force layout can be used in one of the following modes:
-
Standard mode: This is the default mode. In this mode, all vertices of the graph gravitate towards each other equally regardless of their label or property values.
Figure: Default Force Layout
Description of the illustration force_layout.png
Also, note that in densely populated graphs, the combination of vertex size and vertex count can generate strong repulsion forces in the force layout. This causes vertices to be pushed too far apart. You can correct this behavior by:
-
Reducing the number of vertices displayed per page.
-
Decreasing the size of vertices through styles.
-
Lowering the
spacingproperty of the force layout. -
Increasing the
velocityDecayproperty of the force layout.
-
-
Cluster mode: You can activate the cluster mode by setting
"clusterEnabled": true. In this mode, vertices within the same cluster are attracted more strongly towards each other than those in different clusters, or no cluster. This is useful to visualize clusters or communities of vertices in the graph.You can define the following properties to configure the cluster layout. Note that you can use
clusterOptionsto specify the vertex property which defines the community or cluster membership of the vertices.-
edgeDistance: Sets every edge to the specified length. This can affect the padding between the vertices. -
vertexCharge: Influences the underlying forces (for example, to remain within the viewport, to push vertices away from each other). IfclusterEnabledistrue, then it influences the forces among clusters. -
velocityDecay: Determines the speed of the simulation. -
spacing: Determines the spacing between the vertices. -
clusterEnabled: Determines if a cluster based layout is enabled. -
clusterOptions: Related settings for cluster based layout only. -
clusterBy: By default, the cluster layout uses the first element invertex.labelsto form the cluster. Alternatively,clusterBycan also be set to the property name of a vertex. In such a case, the clusters will be formed based on the property value. -
hideUnclusteredVertices: Determines whether to display the vertices that do not belong to any cluster. Default isfalse.
The following shows an example for cluster layout:
Settings:
{
  ...
  layout:
  {
    type: 'force',
    clusterEnabled: true,
    clusterOptions:
    {
      clusterBy: 'DEPARTMENT_ID',
      hideUnclusteredVertices: true
    }
  }
}
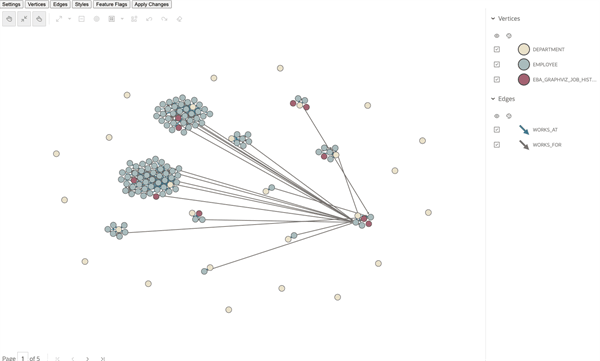
The example aims to create clusters based on
DEPARTMENT_ID. The corresponding visualization using cluster layout is as shown:Figure: Cluster Layout
-
Description of the illustration cluster_layout.png
Geographical Layout
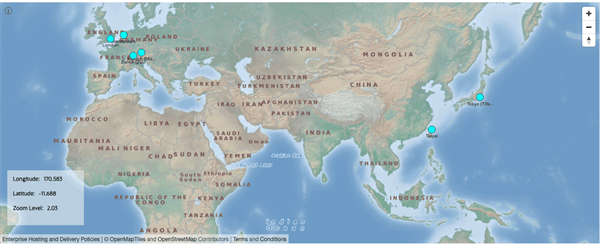
The geographical layout allows you to overlay the graph on a map.
However, this is provided that the latitude and longitude coordinates exist as graph properties on the graph’s vertices.
Figure: Geographical Layout
Description of the illustration geographical_layout.png
You can configure this layout using the following properties:
-
appId: This accepts theapp idthat is used to fetch the maps fromhttp://maps.oracle.com/elocation. If a value is not provided, then a genericappIdwill be used. -
latitude: The vertex property to use for determining the latitude of a vertex. -
longitude: The vertex property to use for determining the longitude of a vertex. -
mapType: You can select the map type in map visualization or graph visualization settings. Alternatively, you can also provide your own sources and layers.The following map types are available:
-
world_map_mb (“oracle-elocation”)
-
osm_positron (default)
-
osm_bright
-
osm_darkmatter
-
custom_type
Note that the custom type has the following two additional fields:
-
sources: Provide your own sources to be used in the map in JSON format.Note: Due to security reasons, the
attributeproperty is separate from visualization. -
layers: Provide layers which you want to display on map in JSON elements array format. For example:[{ "id": "elocation-tiles", "type": "raster", "source": "oracle-elocation" }]
-
-
-
showInfo: Displays an info box in the visualizer (see Figure: Geographical Layout) that shows the Latitude and Longitude of the mouse position and the Zoom Level of the map. Supported values aretrueorfalse. -
showNavigation: Shows the navigation controls towards the top right region of the map. -
markers: Displays location markers on the map. This parameter accepts an array of objects as shown in the following format:interface MapMarker { longitude: number; latitude: number; content?: string; }
Grid Layout
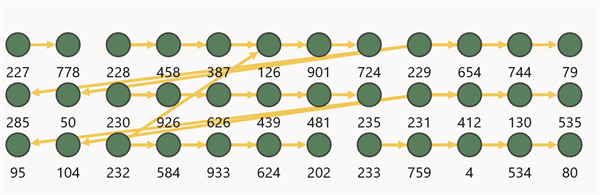
The grid layout positions the graph vertices in a well-spaced grid.
Figure: Grid Layout
Description of the illustration grid_layout.png
You can configure the spacing property to set the space between the elements in the grid.
Hierarchical Layout
The hierarchical layout organizes the graph using Directed Acyclic Graph (DAG) system. It is especially suitable for DAGs and trees.
Figure: Hierarchical

Description of the illustration hierarchical_layout.png
You can configure this layout using the following properties:
-
ranker: Specifies the type of algorithm used to rank the vertices.Supported algorithms are:
-
network-simplex: The Network Simplex algorithm assigns ranks to each vertex in the input graph and iteratively improves the ranking to reduce the length of the edges. -
tight-tree: The Tight Tree algorithm constructs a spanning tree with tight edges and adjust the ranks of the input vertex to achieve this. A tight edge is one that has a length that matches itsminlenattribute. -
longest-path: The Longest Path algorithm pushes the vertices to the lowest layer possible, leaving the bottom ranks wide and the edges longer than necessary.
-
-
rankDirection: Controls the alignment of the ranked vertices. Supported values are:UL(upper left),UR(upper-right direction),DL(down-left direction),DR(down-right direction),TB(top-to-bottom direction),BT(bottom-to-top direction),LR(left-to-right direction),RL(right-to-left direction). -
vertexSeparation: Sets the horizontal separation between the vertices. -
edgeSeparation: Sets the horizontal separation between the edges. -
rankSeparation: Sets the separation between two ranks(levels) in the graph.
Radial Layout
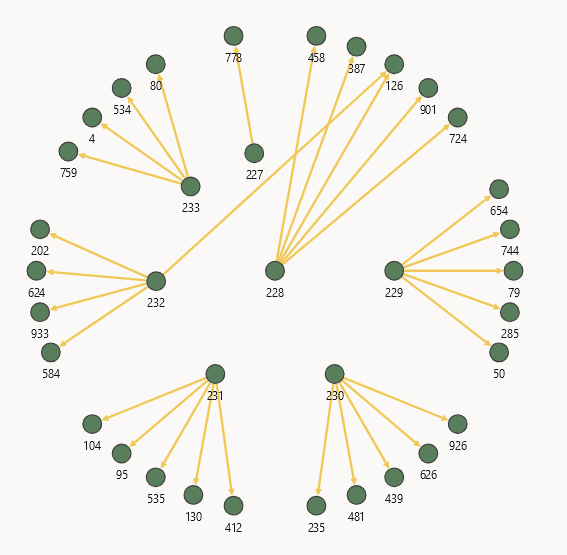
The radial layout displays the dependency chain of a graph by using an outwards expanding tree structure. It can be especially useful if the graph data has a hierarchical structure and contains many children for each parent vertex.
Figure: Radial Layout
Description of the illustration radial_layout.png
You can configure the spacing property to set the spacing between neighboring vertices if they share the same parent vertex. If set to zero, no spacing will be applied.
Random Layout
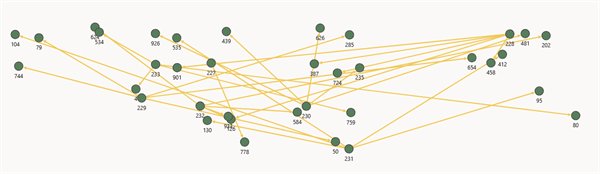
The random layout puts the graph vertices in random positions within the viewport.
Figure: Random Layout