Modeler User Interface
The Modeler user interface lets you create new property graphs and edit existing ones.
The following shows the Modeler landing page:
Figure: Modeler Landing Page
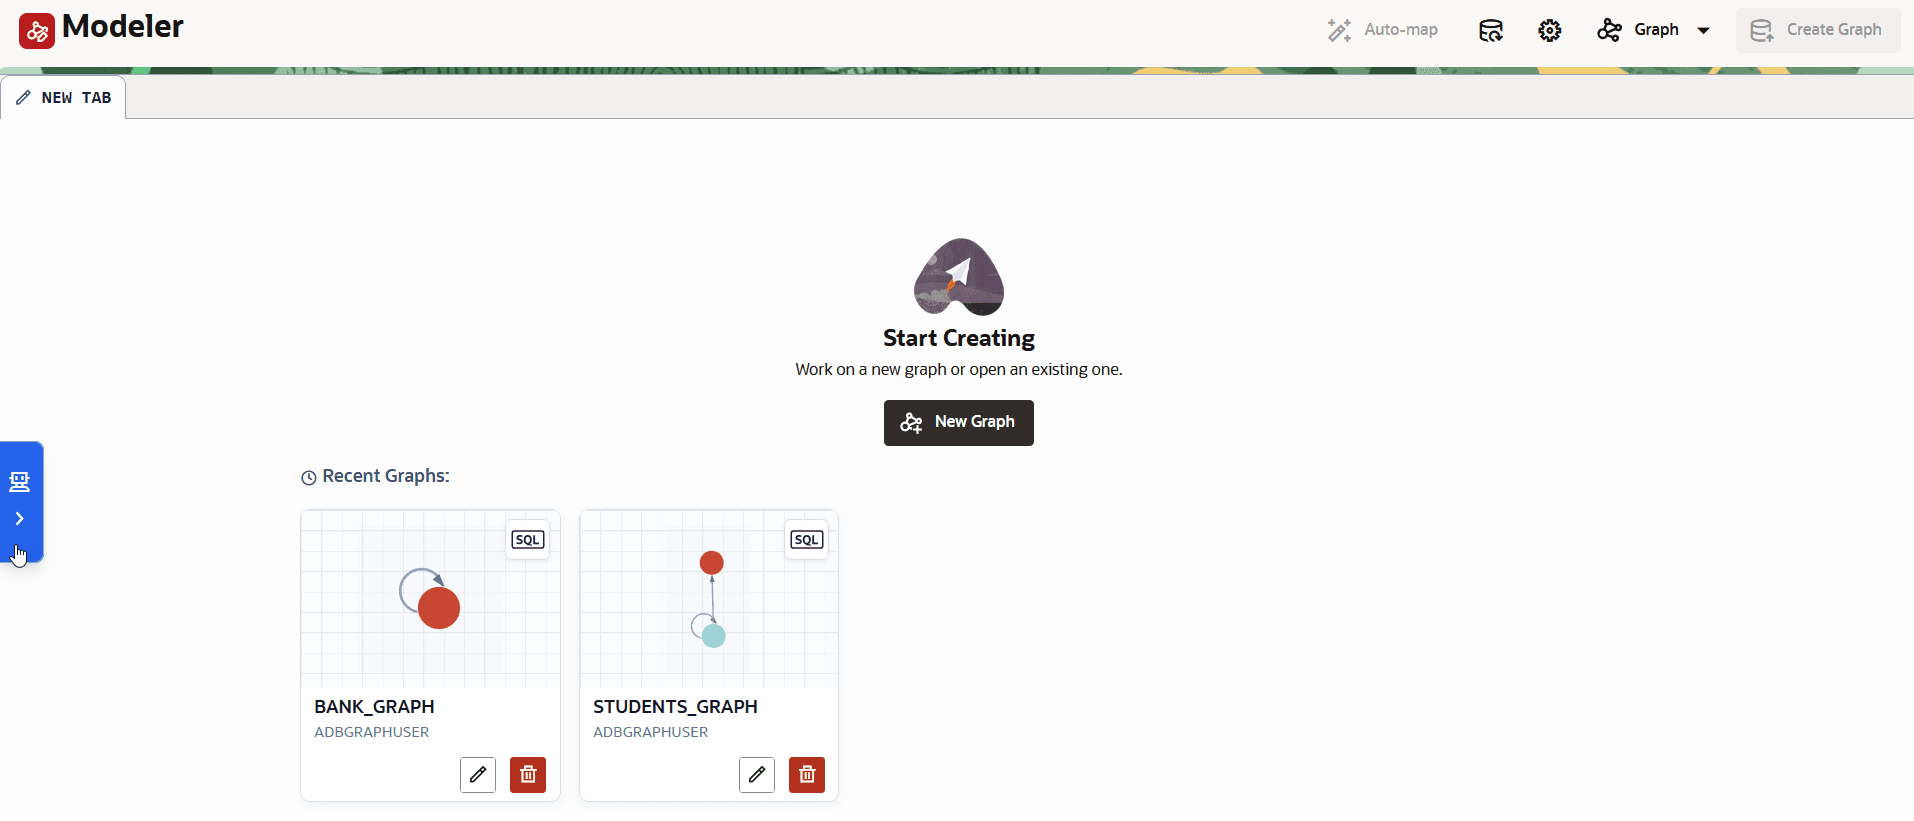
Description of the illustration modeler_landing_page.png
You can perform any of the following actions:
-
Click New Graph to get started creating a new property graph.
-
Click the Edit icon on an existing graph to modify it.
-
Expand the Graph Assistant panel by clicking the arrow on the left side of the page, and then create a property graph using natural language.
The following shows the user interface for the graph modeling page:
Figure: User interface for Graph Modeling
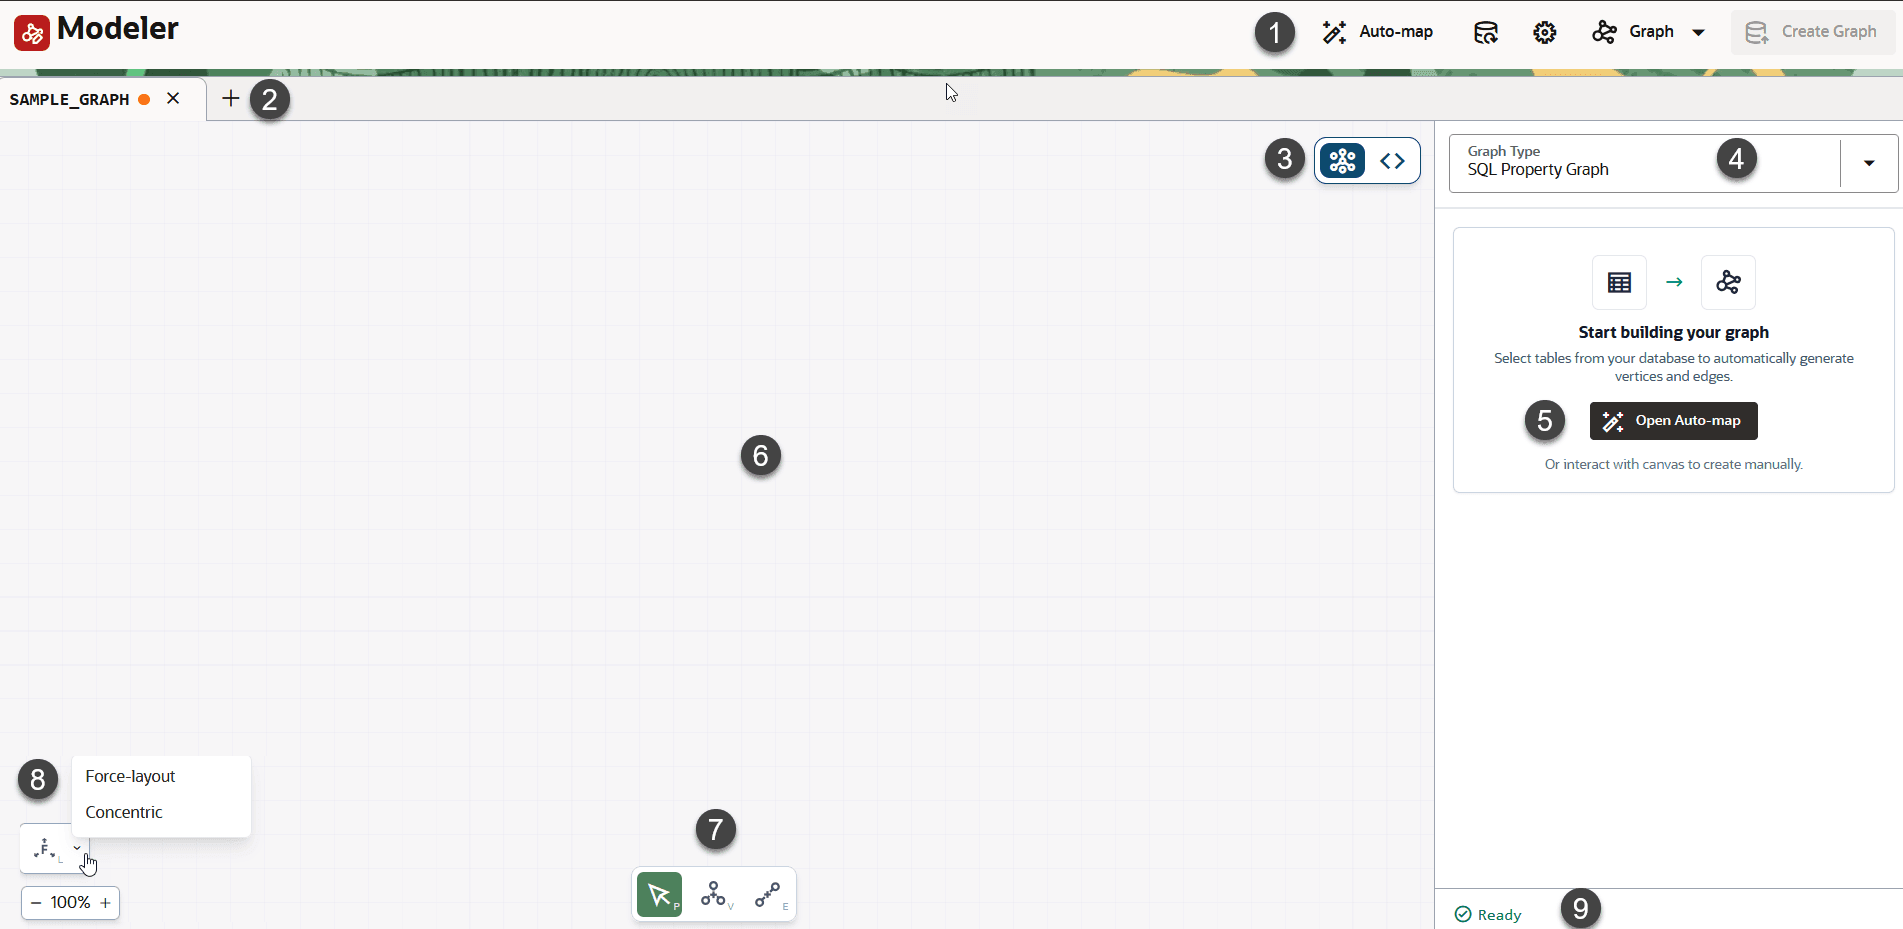
Description of the illustration graph_modeling_page_ui.png
-
Modeler Toolbar: Supported actions are:
-
Auto-map: Invoke this feature to automatically generate a SQL or PGQL property graph from selected database tables by detecting foreign key relationships.
-
Sync Database: Click to refresh the graph model with changes to the underlying database schema. You can configure automatic synchronization by enabling Auto Sync and specifying the synchronization interval in Figure: Modeler Settings.
-
Settings: Click to configure the settings for the Visual Editor, Graph Assistant, and database synchronization.
-
Graph Actions: Select one of the following:
-
New graph: Select to get started modeling a new property graph.
-
Create a copy: Select to create a copy of an existing property graph.
-
-
Create Graph: Click to create a new property graph in the database.
-
-
Graph Tabs: Displays the currently open property graph model. Click the + icon to create additional graph tabs. If Auto-name New Graphs is enabled in Settings, a default graph name is generated automatically and displayed as the tab name. Otherwise, you can specify the graph name before creating the graph.
-
Canvas / Code View toggle: Switch between the visual editor and code editor.
-
Graph Type: Select the graph type for creation:
-
SQL Property Graph: The option to create a SQL property graph is available only if you are using a database instance with Oracle AI Database 26ai.
-
PGQL Property Graph: The option to create a PGQL property graph is available on all supported database versions.
-
-
Open Auto-map: Click to invoke this feature to automatically generate a SQL or PGQL property graph from selected database tables by detecting foreign key relationships.
-
Graph Modeling Canvas: The interactive workspace where you visually model the property graph by creating, connecting, and arranging vertices and edges.
-
Visual Editor tools: Tools for manually building the graph, including adding vertices and edges to the canvas.
-
Layout Controls: Automatically arranges the property graph on the canvas. Click F to apply a force-directed layout. Use the directional arrows to orient the concentric layout on the canvas.
-
Status Bar: The status bar can display warnings, indicate when the graph is ready for creation, and can also show database syncing messages.