4.7 Monitoring the SQLcl MCP Server
Learn how you can monitor the health, status, and activity of your SQLcl MCP Server.
4.7.1 Checking Server Status
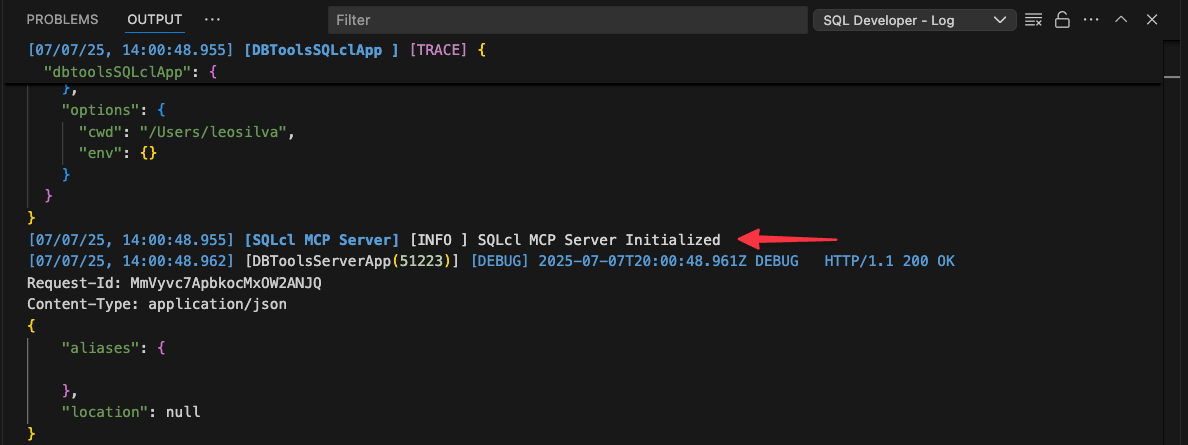
When the SQLcl MCP Server starts successfully, it displays a confirmation message with the startup timestamp, indicating it’s ready to accept connections from the MCP client.
You can verify this message on the SQL Developer - Log output
panel to confirm server readiness. Here's an example server message
on startup:
Description of the illustration mcp_server_initilize.png
4.7.2 Tracking Activity with Logs
The SQLcl MCP Server provides two main ways to track and monitor database operations: a historical audit trail and real-time session monitoring.
Reviewing the Audit Trail
The server automatically records the execution history of every request
in the DBTOOLS$MCP_LOG table. This table provides a complete audit
trail of all database operations the server performs. It captures request details,
execution times, and results to help you with analysis and troubleshooting.
To maintain optimal database performance, you should prune the
DBTOOLS$MCP_LOG table regularly. Consider setting a record
limit (for example, 1000 records) and creating an automated cleanup procedure to
prevent excessive log accumulation.
To view the audit trail, run a query similar to the following
example:
Description of the illustration mcp_logs.png
Monitoring Live Sessions
If you have database administrator (DBA) privileges, you can monitor
active MCP connections and operations in real-time. The server integrates with
Oracle's V$SESSION view, allowing you to use standard Oracle
monitoring tools to track current sessions, resource usage, and performance. To see
the MCP client information, you can observe the MODULE and
ACTION values in V$SESSION.
To view active sessions, query the V$SESSION view:
select * from V$SESSION;4.7.3 Assessing Server Health Through Performance
You can gauge server health by observing its performance.
- Normal Operation: Under normal operation, you should experience consistent response times and smooth database operations.
- Potential Issues: If you are experiencing issues, you may notice delayed responses, connection errors, or incomplete results. If these occur, check your client's logs to begin troubleshooting.