3.13 Post-Execution Debugging of MLE JavaScript Modules
This feature enables developers to seamlessly troubleshoot and refine their JavaScript code running inside Oracle Database as MLE modules. With this, you gain deep insights into your code’s behavior after execution by leveraging familiar debugging workflows.
Post execution debugging allows you to:
- Set breakpoints within your deployed MLE JavaScript modules.
- Initiate and control debugging sessions to inspect code flow.
- Step through code (continue, step in, step out) to analyze logic and execution paths.
- Examine variable values and call stacks to diagnose and resolve issues efficiently.
- Stop or restart debugging sessions for iterative development.
Debugging MLE Module
- Prepare the MLE function and the invoking script.
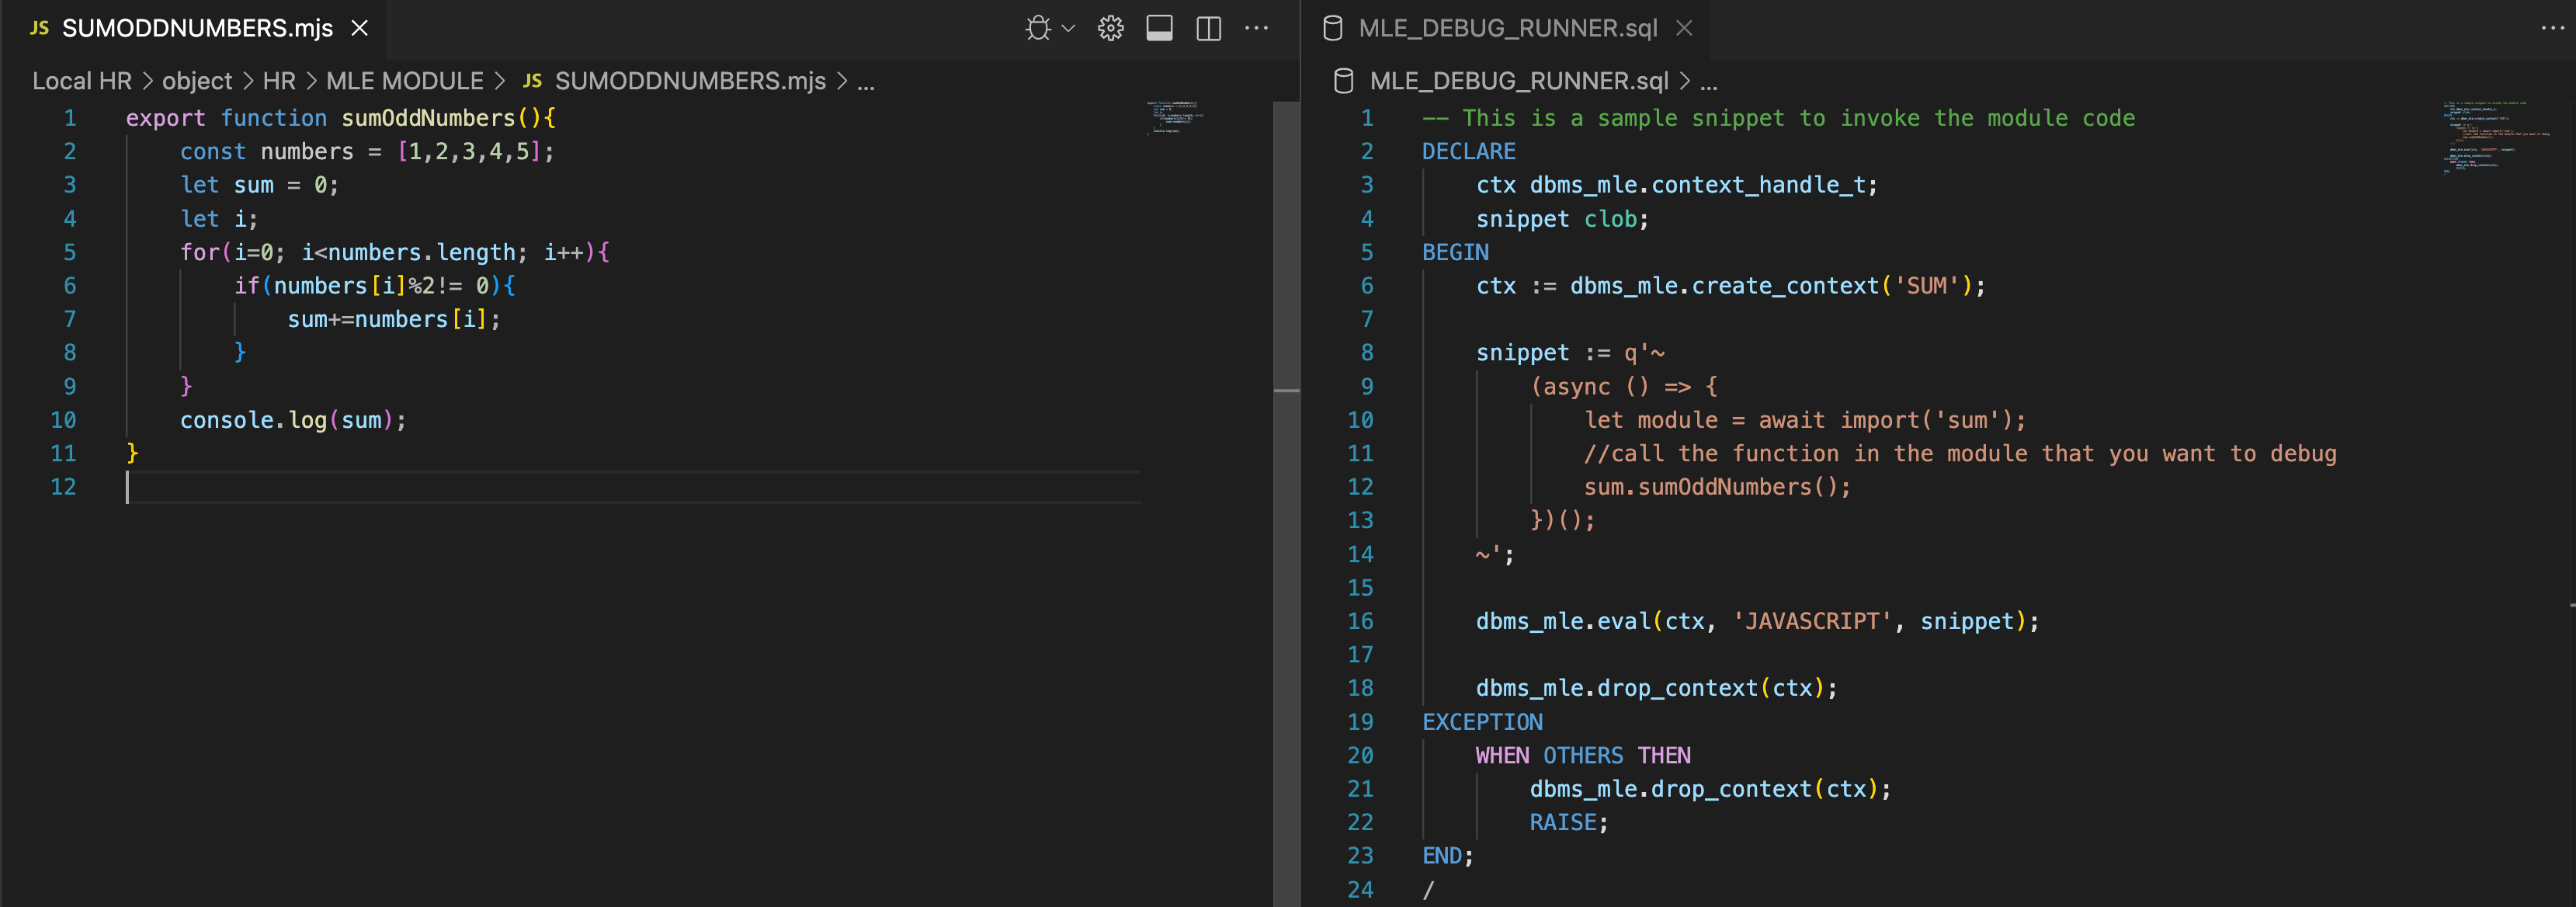
- Ensure your JavaScript function is defined in your MLE module.
- You need a debug runner file that invokes the function. You can open a new debug runner file containing a sample DBMS_MLE snippet to help invoke the MLE module code for debugging or open an existing debug runner file from your local file system. See About the Debug Runner File.
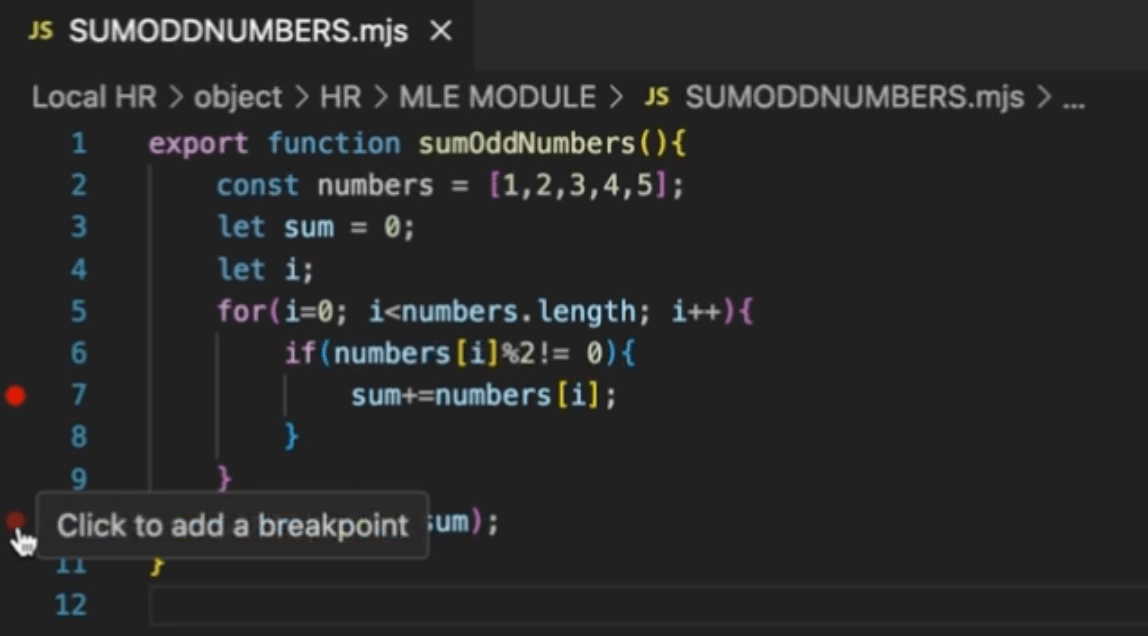
- Before debugging, set breakpoints in your JavaScript code by
clicking in the gutter next to the line numbers.
Note:
You must set at least one breakpoint before starting a debug session. Once a debug session is active, you cannot add new breakpoints. To add more, terminate the current debug session, set new breakpoints, then start a new session. - With your debug runner file and breakpoints ready, start the debug
session using
 (Start post-execution debugging) icon in the
toolbar.
Only one debugging session can run at a time.
The execution will pause at each defined breakpoint. You can inspect variables, view the call stack, and use debug control buttons (continue, step over, step in/out). When all breakpoints are hit or the execution flow ends, the debug session is terminated.
About the Debug Runner File
The debug runner file, typically a SQL worksheet, contains the logic that initiates debugging of the JavaScript code. This file can be associated with any database connection. Make sure all required database objects (such as the MLE module, environment, procedures, and functions) exist in the current connection. If these objects are missing, execution will fail and an error message will be displayed in the Script Output panel (in addition to a warning), because the invoking code is executed in the connection before debugging starts.
Filtering and Breakpoint Management
In the Breakpoints panel, all breakpoints from all open modules are listed. Each breakpoint is associated with a specific database connection, which is shown in the file path or context next to the breakpoint.You can filter the list to show breakpoints only for a selected connection, making it easier to focus on relevant modules during your debug session.
If a breakpoint is linked to a different connection than the one currently being used in your debug session, it is automatically disabled. Disabled breakpoints appear grayed out in the list. When you hover over a disabled breakpoint, a tooltip appears explaining the reason for the breakpoint's status.

