Introduction to the AI Enrichment Dashboard
The AI Enrichment dashboard provides a consolidated view of database schema, allowing you to monitor and manage schema enrichment activities in one place. With this dashboard, you can easily track the progress of annotations and enrichment across tables and columns, helping ensure completeness throughout your schema.
To open the AI Enrichment dashboard:
In the Connections panel, expand your database connection and click + on the AI Enrichment node. Alternatively, right-click the AI Enrichment node and select AI Enrichment Dashboard.
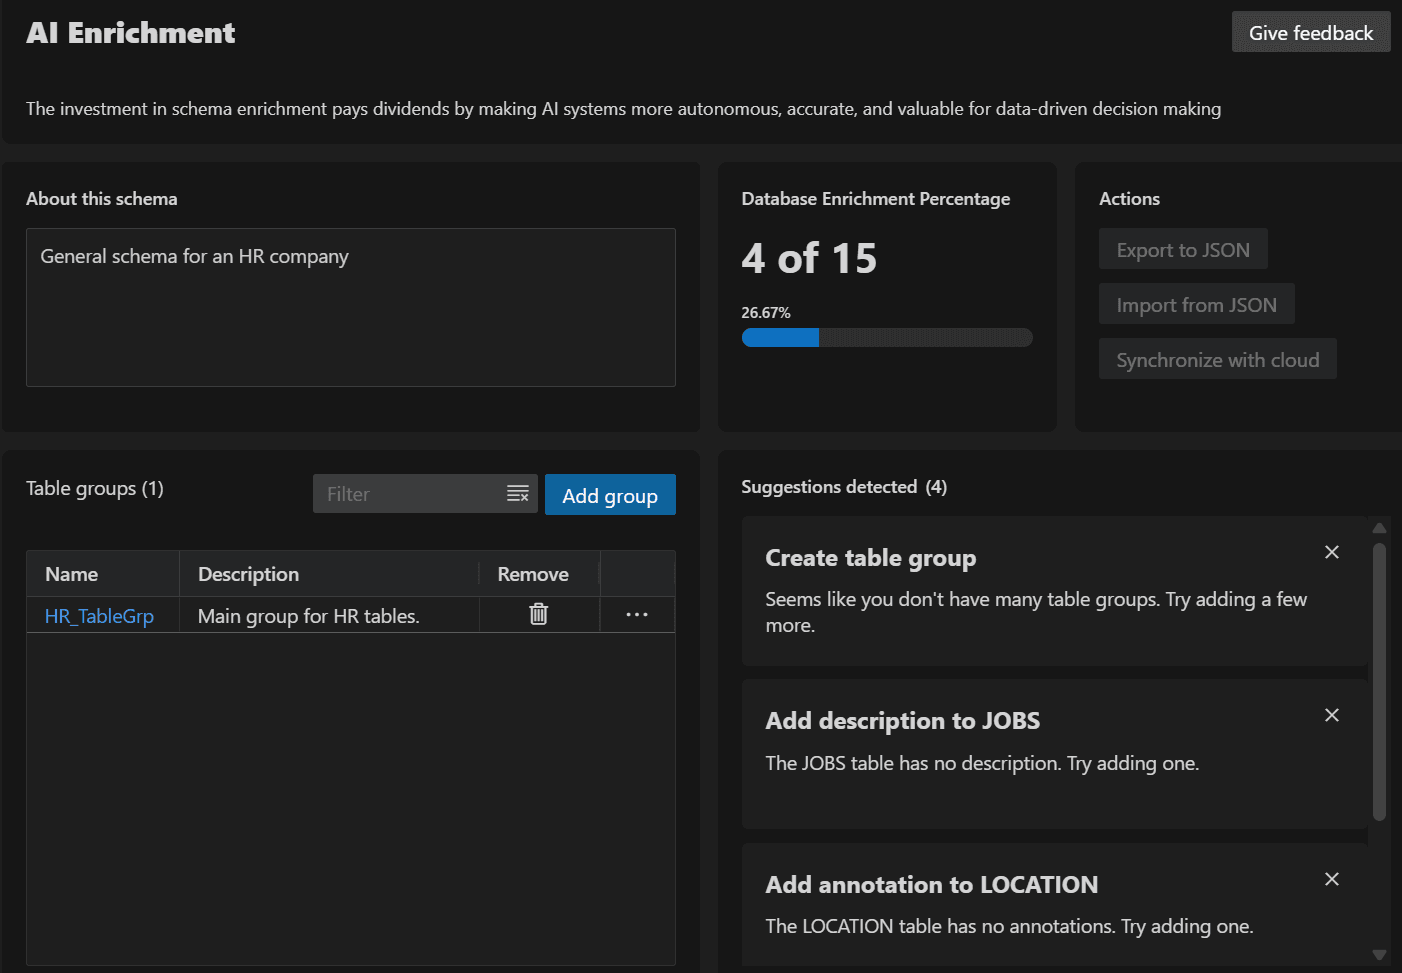
The AI Enrichment Dashboard is divided into following key sections:
-
About this schema: Allows you to enter the high-level description for the schema. For more information, see High-Level Schema Description.
-
Table groups: Allows you to logically group related tables and displays the existing groups in the schema. For example, all tables related to Human Resources can be grouped into an HR table group. For more information, see Managing Table Groups.
-
Database Enrichment Percentage: Allows you to view the percentage completion of Al Enrichment in your schema. If none of the schema objects (tables or columns) are annotated, the enrichment percentage will be 0%. As more tables and columns within the schema are enriched, this percentage increases accordingly. This metric helps you track progress and measure how extensively enrichment has been applied within a given schema.
-
Suggestions detected: Displays helpful hints and recommended next steps to guide users in maximizing the effectiveness of schema enrichment.
-
Export to JSON: Allows you to export selected schema, table group, table, and column enrichment data to a JSON file.