Rendering Output as Charts
SQL Notebook Charting enables you to instantly transform query results into interactive visualizations directly within the SQL notebooks. When you run a SQL or PL/SQL statement, the output is displayed in a table format by default. You can now choose to view the output in various chart formats.
To view the output as a chart:
-
On a code cell, click More Actions (…).
A menu appears with options for additional cell actions.
-
Select the View as option.
A context menu with various chart options is displayed. For more information, see Additional Cell Configuration Options.
-
Select a chart option to view the output in the desired format.
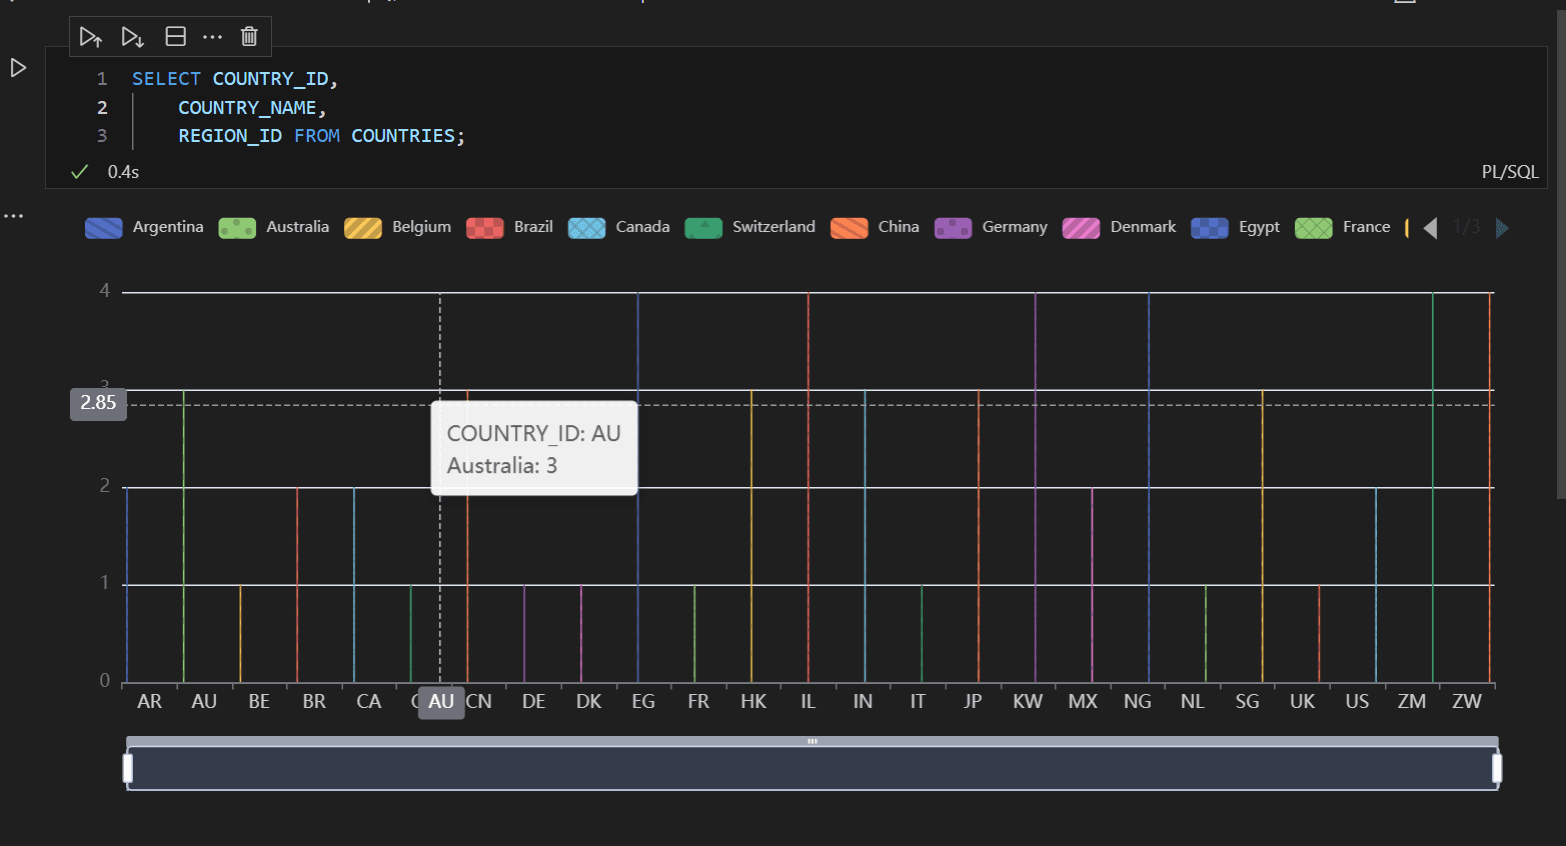
The following example shows the output as a basic bar chart: