1.6 Using DBA Features
SQL Developer Web enables users with DBA (database administrator) privileges to monitor and manage the Oracle database in the Oracle Cloud. To configure a DBA user, see Administering Oracle Database Cloud Service.
The DBA tab provides quick and easy access to a variety of information about the database instance. The management capabilities include changing the TDE (Transparent Data Encryption) Keystore Password, and creating, dropping, plugging in, unplugging, cloning, and modifying the state of a pluggable database.
1.6.1 Overview
The Overview page displays generic information about the database instance. For Oracle Database 12c and later databases, you can filter the information displayed by selecting CDB or the required PDB from the drop-down list at the top of the page.
The widgets on this page show snapshot information about the database status, listener status, online database storage, alerts, sessions, wait events, movements, latest backup status, and a list of the executed SQL statements on the database, ordered by the most CPU time consumed. Click a widget to go to its page where you can see a more detailed view of the data. If a PDB is selected, the Listener, Backups, Movements and Parameters widgets are not available. For a PDB in mounted mode, only the Manage option is available.
The widgets on this page are:
-
Database Status: See Managing Pluggable Databases
-
Online Database Storage: See Viewing Tablespace and Segment Space Usage
-
Sessions: See Viewing Sessions Information
-
Waits: See Viewing Wait Events
-
Listener Status: See Viewing Listener Status
-
Latest Backup: See Viewing Backup Logs
-
Users: See Users
-
Alerts: See Viewing Alert Log Entries
-
Expiring Passwords: See Expiring Passwords
-
Movements: See Monitoring SQL Developer PDB Uploads
-
Top SQL: See Top SQL
Users
You can view how many user accounts are in the following states for the entire database or for a specific pluggable database:
-
Open: This status indicates that the user’s account is unlocked and access to the database is enabled.
-
Locked: This status indicates that the user’s account is locked and access to the database is disabled. The account must be unlocked to enable access to the database.
-
Expired: This status indicates that the user’s password has expired and must be changed before the user can log in to the database.
Expiring Passwords
In the Expiring Accounts Password box, you see a list of user accounts and whether a user account password has expired or the number of days before it will expire.
Top SQL
Top SQL lists the most expensive SQL statements executed in the database, in terms of CPU time consumed. It enables you to focus your SQL tuning efforts on the statements that can have the most impact on database performance. Click a query to see a formatted view of the SQL statement, its execution plan, its runtime history from Active Session History, and a SQL Tuning Advisor report
Related Topics
1.6.2 Managing Pluggable Databases
To reach the Manage page, from the DBA drop-down menu, click Manage. In the Manage page, you can see the status of the database instance. For Oracle Database 12c and later databases, the status of pluggable databases are also displayed. You can also create, clone, plug, unplug, or drop pluggable databases.
1.6.2.1 Changing the TDE Keystore Password
Note:
This feature is only available for Oracle Database 12c and later versions.
To change the TDE keystore password:
1.6.2.3 Plugging in a Pluggable Database
Plugging in consists of creating a pluggable database (PDB) based on specifications in the XML file, from when the original PDB was unplugged.
1.6.2.4 Cloning a Pluggable Database
Cloning a pluggable database (PDB) is to create a new PDB from (using basic specifications of) a specified PDB.
1.6.3 Viewing Listener Status
The Listener page shows the status of the listener and the output of the lsnrctl command.
The Oracle Net Listener (the listener) is a process that resides on the database server. It listens for incoming client connection requests and manages traffic to the server.
To review listener status information:
-
From the DBA drop-down menu, click Listener.
The Listener page shows the following information:
-
Status of the listener, including start time
-
Protocol addresses the listener is configured to listen on
-
Summary of the database services registered with the listener and the service handlers allocated to each service
-
Registered database services (service name), database instance associated with the service, and connection status
1.6.4 Viewing Backup Logs
The Backups page shows the logs for the automatic backups that have been attempted on this server. These backups include both the database and the configuration files.
In the display table, if you right-click the header row, you see:
Columns: Enables you to select columns to show or hide.
Sort: Displays a dialog box for selecting columns to sort by. For each column, you can specify ascending or descending order, and you can specify that null values be displayed first.
If you right-click any other part of the display table, you see:
Count Rows: Displays the number of rows in the table.
Single Record View: Enables you to view data for a table or view, one record at a time.
1.6.5 Viewing Alert Log Entries
The Alerts page is a chronological log of messages and errors and is commonly used to learn whether the background processes have encountered errors. You can review the alert log periodically to verify that your database system is operating normally.
The alert log includes the following:
-
Nondefault initialization parameters used at startup
-
Administrative operations, such as STARTUP, SHUTDOWN, ARCHIVE LOG, RECOVER, and CREATE/ALTER/ DROP DATABASE/TABLESPACE
-
Messages and errors relating to the functions of certain background processes, such as LGWR
-
Internal errors (ORA-600), block corruption errors (ORA-1578), and deadlock errors (ORA-60)
For Oracle Database 12c and later releases, you can use the CDB/PDB drop-down list to filter the information displayed for the container or pluggable database.
You can search for a specific value in the log by selecting the display column in the first drop-down list, selecting the condition in the second drop-down list, entering the search value in the box, and clicking the search icon.
In the display table, if you right-click the header row, you see:
Columns: Enables you to select columns to show or hide.
Sort: Displays a dialog box for selecting columns to sort by. For each column, you can specify ascending or descending order, and you can specify that null values be displayed first.
If you right-click any other part of the display table, you see:
Count Rows: Displays the number of rows in the table.
Single Record View: Enables you to view data for a table or view, one record at a time.
1.6.6 Viewing Sessions Information
The Sessions page shows information about all currently open sessions in the database. The data is automatically refreshed at intervals ranging from 10 seconds to 2 minutes. You can also refresh the data by clicking the Refresh icon at the top right of the screen.
For Oracle Database 12c and later databases, you can use the CDB/PDB drop-down list to filter the information displayed for the container or pluggable database.
The table shows summarized data about each open session. Select a session in the table to see more detailed data in the Session Details table below, such as the last SQL statement, explain plan, waits, contention, and so on. You can use the Column, Operator and Value fields to search for the required sessions.
In the display table, if you right-click the header row, you see:
Columns: Enables you to select columns to show or hide.
Sort: Displays a dialog box for selecting columns to sort by. For each column, you can specify ascending or descending order, and you can specify that null values be displayed first.
If you right-click any other part of the display table, you see:
Count Rows: Displays the number of rows in the table.
Single Record View: Enables you to view data for a table or view, one record at a time.
1.6.7 Viewing Tablespace and Segment Space Usage
The Storage page shows the storage used based on the current allocation of tablespaces along with additional drill-down capabilities to view segments. You can refine the list of segments shown by using the filter feature. Click View Datafiles to view the datafiles in each tablespace.
You can view tablespace and segment space usage.
A tablespace is a database storage unit that groups related logical structures together. A tablespace is comprised of datafiles. A segment is a set of extents allocated from a tablespace for a specific database object such as a table or index.
To view space usage information
-
From the Database drop-down menu, click Storage .
The Storage page displays. If the Oracle database is version 12c or later, the Storage page shows the used and allocated storage space for all tablespaces in the container in the root, and the used and allocated storage space for tablespaces in any pluggable databases. If the Oracle database is version 11g, the Storage page shows the used and allocated space for the entire database.
-
For an Oracle database version 12c or later, you can click show tablespaces for the container database, or click show tablespaces for each pluggable database.
-
When you click show tablespaces, a list of tablespaces appears. You can click a tablespace to view its storage information. An interactive report appears, showing the segments that exist within the tablespace. Most segments are user objects, and they include tables, LOBs, and indexes.
-
On the Segments page, you can refine the list of segments shown by using the filter feature.
For example, you can search for all the segments for a specific owner (schema) by selecting OWNER from the first drop-down list, entering the owner (schema) name in the box, and clicking the search icon.
1.6.8 Viewing Wait Events
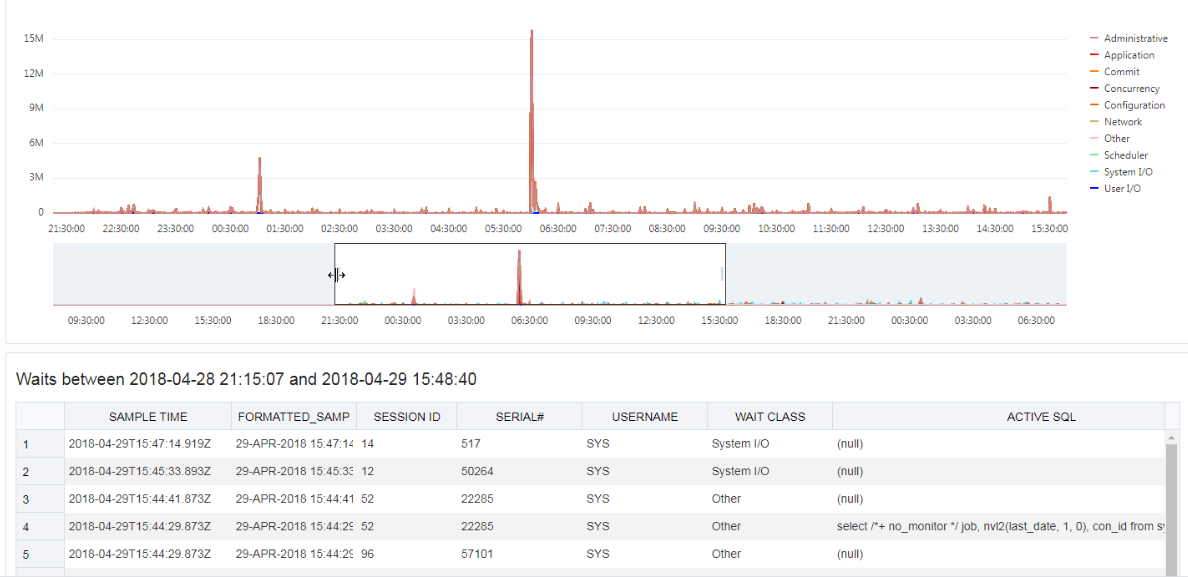
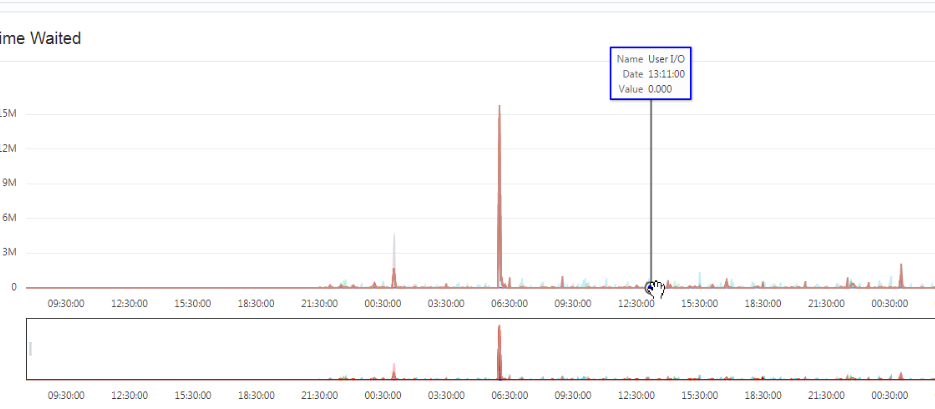
The Waits page shows a chart with the distribution of wait events in real time. For Oracle Database 12c and later databases, you can use the CDB/PDB drop-down list to filter the information displayed for the container or pluggable database.
Use the slider controls in the small chart to zoom in on a specific time period in the chart above. To use the slider controls, place the cursor over the handles at both sides of the box and drag the sides to the time period required. The chart above will refresh to the selected time period. The table will also automatically refresh and the wait events will filter to that period of time enabling you to easily identify the problem SQL statement.
Figure 1-1 Distribution of Wait Events Chart

Description of "Figure 1-1 Distribution of Wait Events Chart"
When you place the cursor over data points in the chart, a pop-up box displays details about the wait event.
1.6.9 Monitoring SQL Developer PDB Uploads
The Movements page enables you to monitor current and past SQL Developer pluggable database uploads to the database server. See Using Pluggable Databases (PDBs) to Load Data into the Database.
From the DBA drop-down menu, select Movements.
1.6.10 Viewing Initialization Parameters
Initialization parameters configure the database instance, including memory structures, and define locations for database files. Values for initialization parameters are stored in a text-based initialization parameter file (PFILE) or binary server parameter file (SPFILE). The initialization parameter file is read at database instance startup.
Note:
For more information, see “Initialization Parameters” in Oracle Database Reference.To perform a search, enter values in the search criteria columns and click the search icon to locate the initialization parameter.
In the display table, if you right-click the header row, you see:
Columns: Enables you to select columns to show or hide.
Sort: Displays a dialog box for selecting columns to sort by. For each column, you can specify ascending or descending order, and you can specify that null values be displayed first.
If you right-click any other part of the display table, you see:
Count Rows: Displays the number of rows in the table.
Single Record View: Enables you to view data for a table or view, one record at a time.
1.6.11 Viewing Real Time SQL Monitor
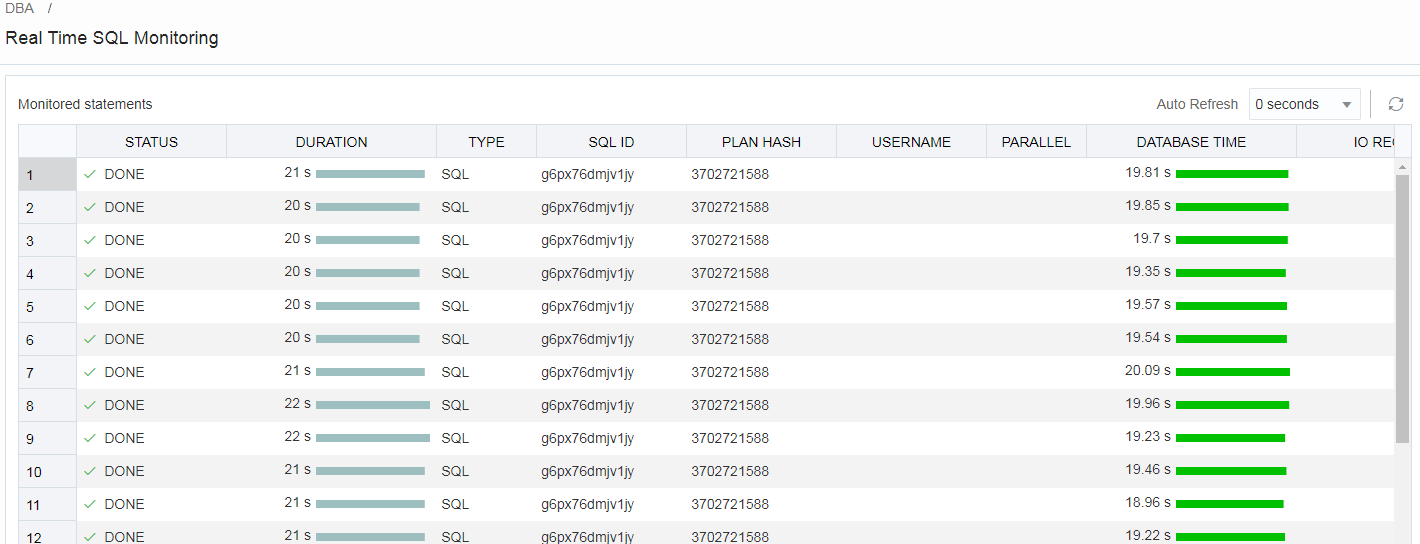
The Real Time SQL Monitor page shows in real time the SQL statements that are being monitored in the database. In the Auto Refresh drop-down list, you can select the time (in seconds) to periodically refresh the data. Select 0 seconds to disable the auto-refresh. For Oracle Database 12c and later databases, you can use the CDB/PDB drop-down list to filter the information displayed for the container or pluggable database.
To review the SQL statements being monitored:
-
From the DBA drop-down menu, click Real Time SQL Monitor.
This tool helps identify run-time issues for SQL statements and monitor their behavior, by providing two major functions:
-
General view of monitored statements
-
View of SQL execution details
General View of Monitored Statements
The page contains a table of SQL statements currently running. This table shows the following information:
-
Status: Current state of the SQL statement execution. For example, a SQL statement that has already finished its execution will show a status of "DONE".
-
Duration: Amount of time a SQL statement is taking, or has taken, to execute.
-
SQL ID: SQL identifier of the statement being monitored.
-
Session ID: Session identifier that is executing, or has executed, the SQL statement.
-
Session Serial Number: Uniquely identifies a session's objects.
-
Instance Degree of Parallelism: This Degree of Parallelism (DOP) column shows how many instances and parallel execution servers are allocated. It is shown in the form of “number of instances” | “number of parallel servers”.
-
Database Time: Place the cursor over the database time to see a breakdown of the time and wait events.
-
CPU Time: CPU time consumed by the execution of the query.
-
I/O Time: I/O time consumed by the execution of the query.
-
Start Time: Time in which the execution of the SQL statement started.
-
SQL Statement: SQL statement being monitored.
View of SQL Execution Details
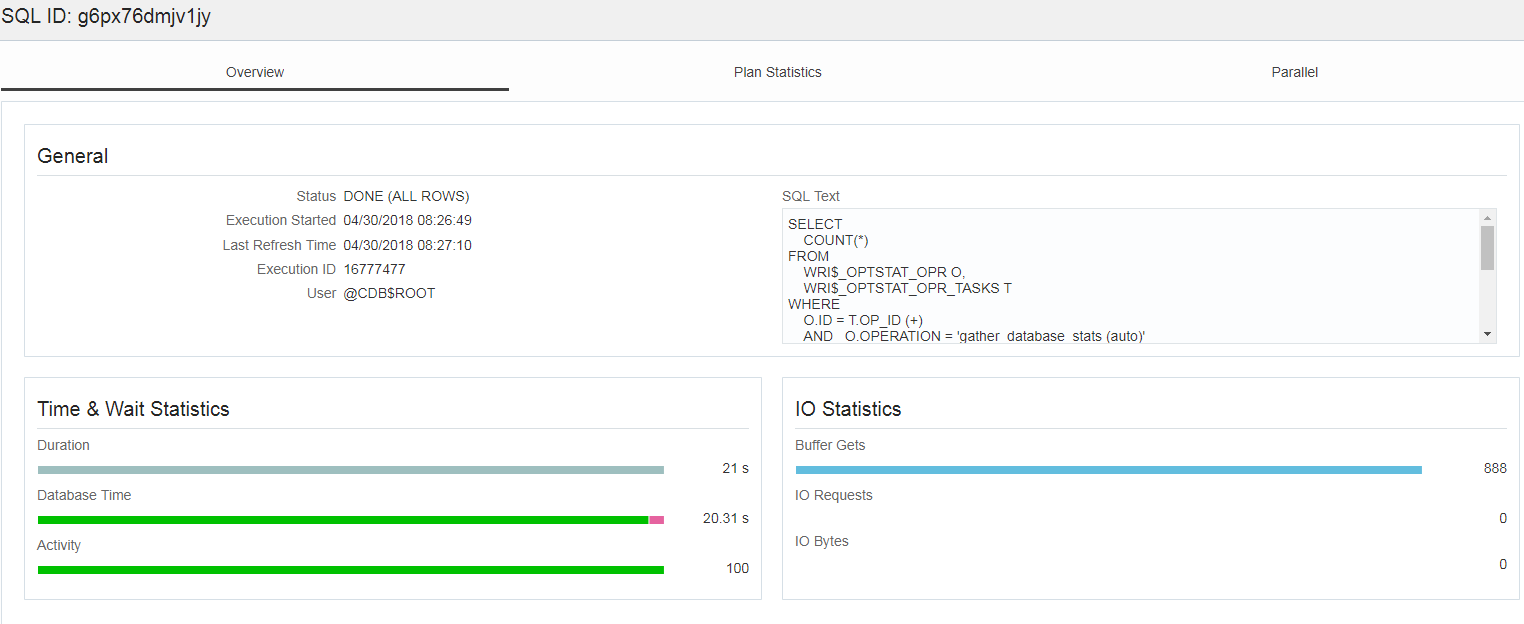
When a SQL statement is drilled down from the main monitor table, a detailed view is shown. The SQL ID, Start Time and the SQL Execution ID represent the execution key that uniquely identify this SQL statement. A detail view consists of the general characteristics that integrate the execution of a SQL statement.
General information about the query execution is provided:
-
Execution Plan: Degree of Parallelism of the SQL statement
-
Execution Started: Time that the SQL statement execution started
-
Last Refresh Time: Last update time of the SQL monitor registry for the SQL statement
-
Execution ID: Execution identifier
-
User: User in the format USER@CONTAINER
-
SQL Text: Formatted view of the SQL statement that is being executed.
Figure 1-4 SQL Execution Details in Real Time SQL Monitor

Description of "Figure 1-4 SQL Execution Details in Real Time SQL Monitor"
General statistics of the SQL statement are provided: total duration of execution, the number of buffered gets, number of Input/Output requests and bytes.
Detailed information of the statement: This space holds the information corresponding to the explain plan, parallel behavior and CPU activity involved in the execution of the statement:
-
Plan Statistics: Explain plan of the execution of the SQL statement in the form of a table. Each row is a different operation involved in the execution of the SQL statement and it shows hierarchy dependency by adding a space at the beginning of the text in the Operation column.
-
Parallelism Details for the SQL statement: Each execution consists of a parallel coordinator and one or more parallel sets. Each set can have one or more processes. When a row has dependents, each of its columns will be the sum of the values of its dependants. When this happens, a sigma symbol will appear to show that a value consists of the sum of others.
Note:
For more information, see "Monitoring the Database" in the Oracle Database Administrator’s Guide.
