7.9 The Real Time SQL Monitoring Page
![]() Available only if you signed in as a database user with
DBA and PDB_DBA roles for Oracle
Database 18c and previous releases.
Available only if you signed in as a database user with
DBA and PDB_DBA roles for Oracle
Database 18c and previous releases.
To navigate to the Real Time SQL Monitoring page, do either of the following:
-
In the Database Actions page, click Real Time SQL Monitor.
-
Click Selector
 to display the left navigation pane. Expand the
Monitoring menu and select Real Time SQL
Monitor.
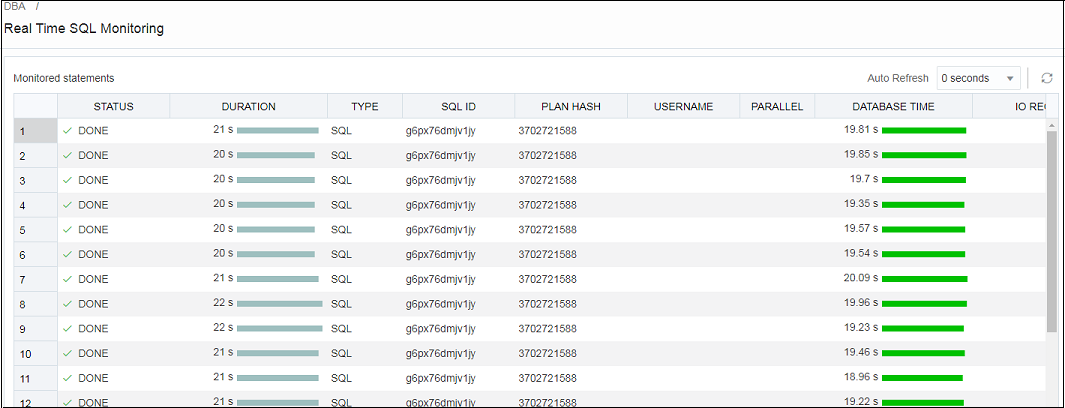
In the Auto Refresh drop-down list, you can select the time (in seconds) to
periodically refresh the data. Select 0 seconds to disable the
auto-refresh.
This tool helps identify run-time issues for SQL statements by providing two major functions:
-
General view of monitored statements
-
View of SQL execution details
General View of Monitored Statements
The page contains a table of SQL statements currently running. This table shows the following information:
-
Status: Current state of the SQL statement execution. For example, a SQL statement that has already finished its execution will show a status of "DONE".
-
Duration: Amount of time a SQL statement is taking, or has taken, to execute.
-
SQL ID: SQL identifier of the statement being monitored.
-
Session ID: Session identifier that is executing, or has executed, the SQL statement.
-
Session Serial Number: Uniquely identifies a session's objects.
-
Instance Degree of Parallelism: This Degree of Parallelism (DOP) column shows how many instances and parallel execution servers are allocated. It is shown in the form of “number of instances” | “number of parallel servers”.
-
Database Time: Place the cursor over the database time to see a breakdown of the time and wait events.
-
CPU Time: CPU time consumed by the execution of the query.
-
I/O Time: I/O time consumed by the execution of the query.
-
Start Time: Time in which the execution of the SQL statement started.
-
SQL Statement: SQL statement being monitored.
View of SQL Execution Details
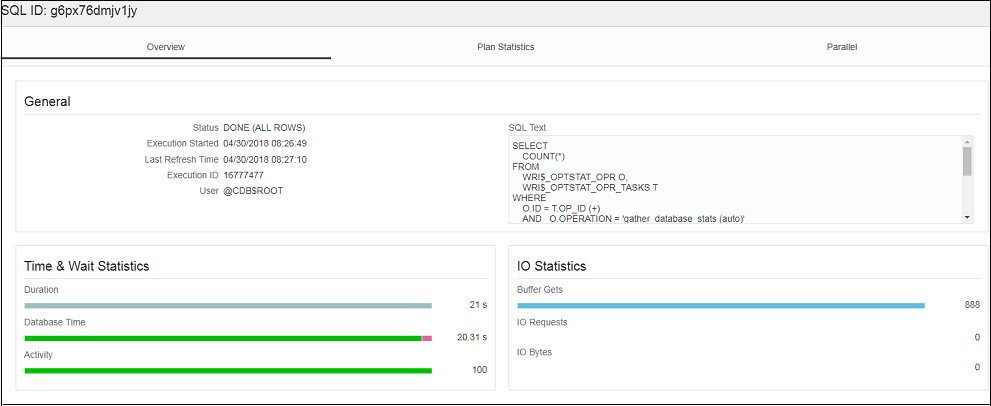
When a SQL statement is drilled down from the main monitor table, a detailed view is shown. The SQL ID, Start Time and the SQL Execution ID represent the execution key that uniquely identify this SQL statement. A detail view consists of the general characteristics that integrate the execution of a SQL statement.
General information about the query execution is provided:
-
Execution Plan: Degree of Parallelism of the SQL statement
-
Execution Started: Time that the SQL statement execution started
-
Last Refresh Time: Last update time of the SQL monitor registry for the SQL statement
-
Execution ID: Execution identifier
-
User: User in the format USER@CONTAINER
-
SQL Text: Formatted view of the SQL statement that is being executed.
Figure 7-5 SQL Execution Details in Real Time SQL Monitor

Description of "Figure 7-5 SQL Execution Details in Real Time SQL Monitor"
General statistics of the SQL statement are provided: total duration of execution, the number of buffered gets, number of Input/Output requests and bytes.
Detailed information of the statement: This space holds the information corresponding to the explain plan, parallel behavior and CPU activity involved in the execution of the statement:
-
Plan Statistics: Explain plan of the execution of the SQL statement in the form of a table. Each row is a different operation involved in the execution of the SQL statement and it shows hierarchy dependency by adding a space at the beginning of the text in the Operation column.
-
Parallelism Details for the SQL statement: Each execution consists of a parallel coordinator and one or more parallel sets. Each set can have one or more processes. When a row has dependents, each of its columns will be the sum of the values of its dependants. When this happens, a sigma symbol will appear to show that a value consists of the sum of others.
Note:
For more information, see "Monitoring the Database" in the Oracle Database Administrator’s Guide.
