3.2.3 Viewing the SQL Output
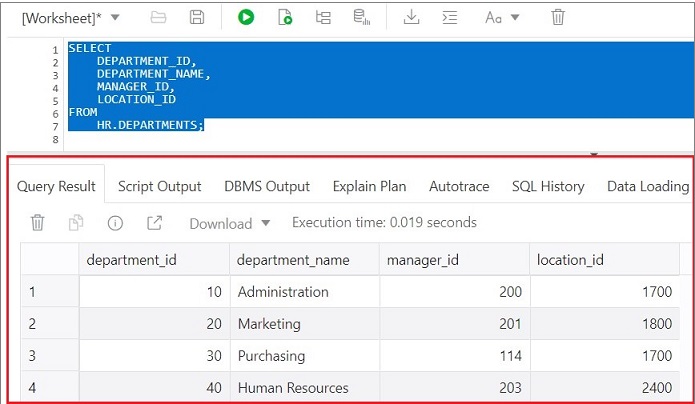
The lower right pane in SQL displays the output of the operation executed in the SQL editor.
The following figure shows the output pane in the SQL page.
The output pane has the following tabs:
-
Query Result: Displays the results of the most recent Run Statement operation in a display table.
-
Script Output: Displays the text output from your statements executed as a script using the script engine.
-
DBMS Output: Displays the output of DBMS_OUTPUT package statements.
-
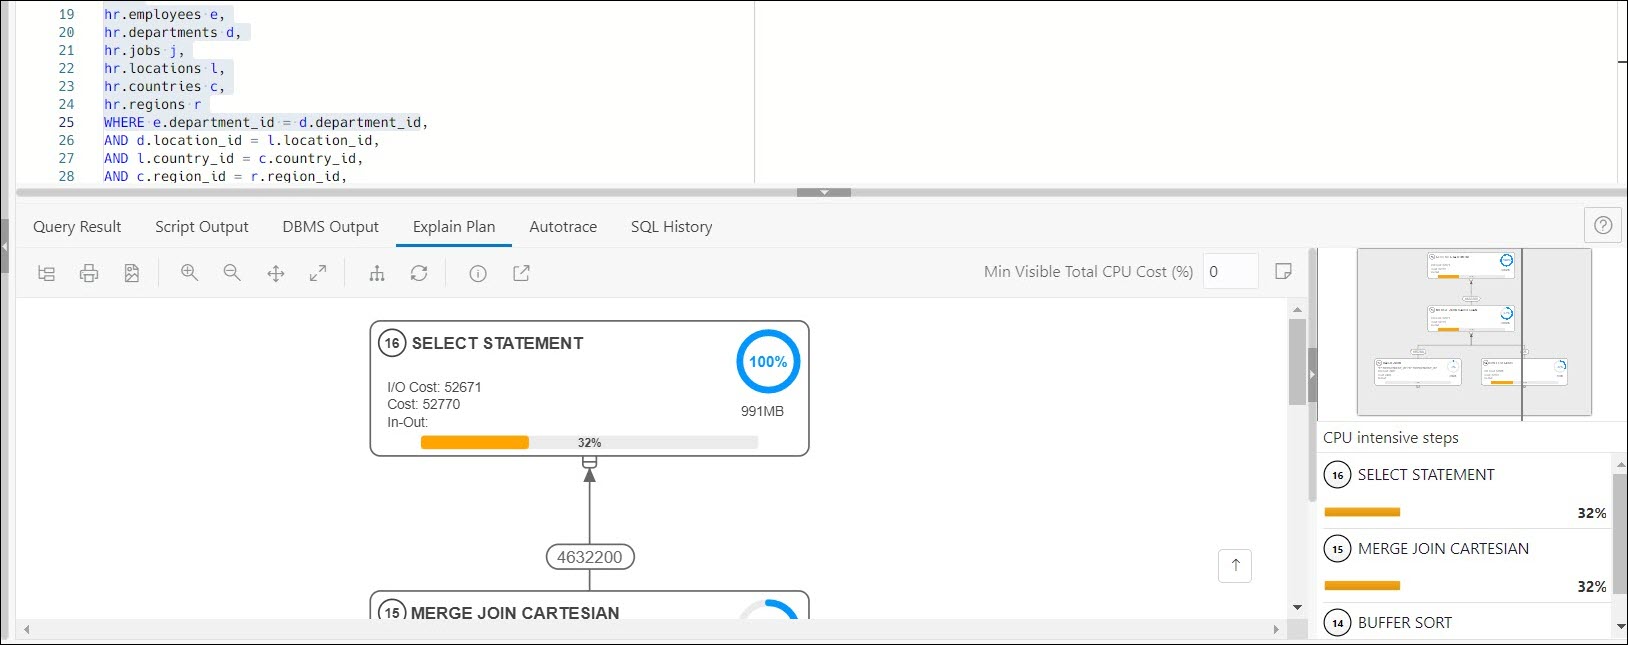
Explain Plan: Displays the plan for your query using the Explain Plan command. The default view is the diagram view. For more information, see Using the Explain Plan Diagram.
-
Autotrace: Displays the session statistics and execution plan from
v$sql_planwhen executing a SQL statement using the Autotrace feature. Displays the output if you clicked the Autotrace icon. -
SQL History: Displays the SQL statements and scripts that you have executed. To re-enter a previously executed query in the worksheet, double-click the query in the history list. You can search for specific statements by clicking the Search icon. The Search functionality is case-sensitive, retrieves all entries that contain the search text, and does not require wildcard characters.
- Data Loading: Displays a report of the total rows loaded and failed for all visible tables (including tables from other schemas).
The icons in this pane are:
-
Clear output: Clears the output.
-
Show info: Displays the SQL statement for which the output is displayed.
-
Open in new tab: Opens the query result or explain plan in a new window.
-
Download: This is applicable only for Query Result. Enables you to download the query result to your local computer in CSV, JSON, XML, or TEXT (.tsv) format.
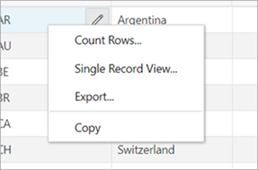
In the Query Result tab, in the display table, the context menu (right-click) for the row header consists of the following:
-
Columns enables you to select columns to hide.
-
Sort displays a dialog box for selecting columns to sort by. For each column, you can specify ascending or descending order, and you can specify that null values be displayed first.
The context menu for the rest of the display table consists of the following commands:
-
Count Rows displays the number of rows in the result set for your query.
-
Single Record View enables you to view data for a table or view, one record at a time.
-
Export generates the file for download based on the format selected, which can be XML, CSV (comma-separated values including a header row for column identifiers), Insert , Delimited, Fixed, HTML, JSON, or TEXT.
-
Format: Select the format to export from the drop-down list.
-
Line Terminator: Identifies the terminator for each line. The line terminator is not included in the data exported. If the preview page shows the data in one single row, the correct terminator is not specified.
-
Header: Controls whether the first row is a header row or the first row of data.
-
Left and Right Enclosure: Enclosures are used for character data and are optional. Enclosures are not included in the data exported.
Note:
If a popup blocker is enabled, it will prevent the file from downloading. -
-
Copy copies data from a cell or a row or a range of rows.
3.2.3.1 Using the Explain Plan Diagram
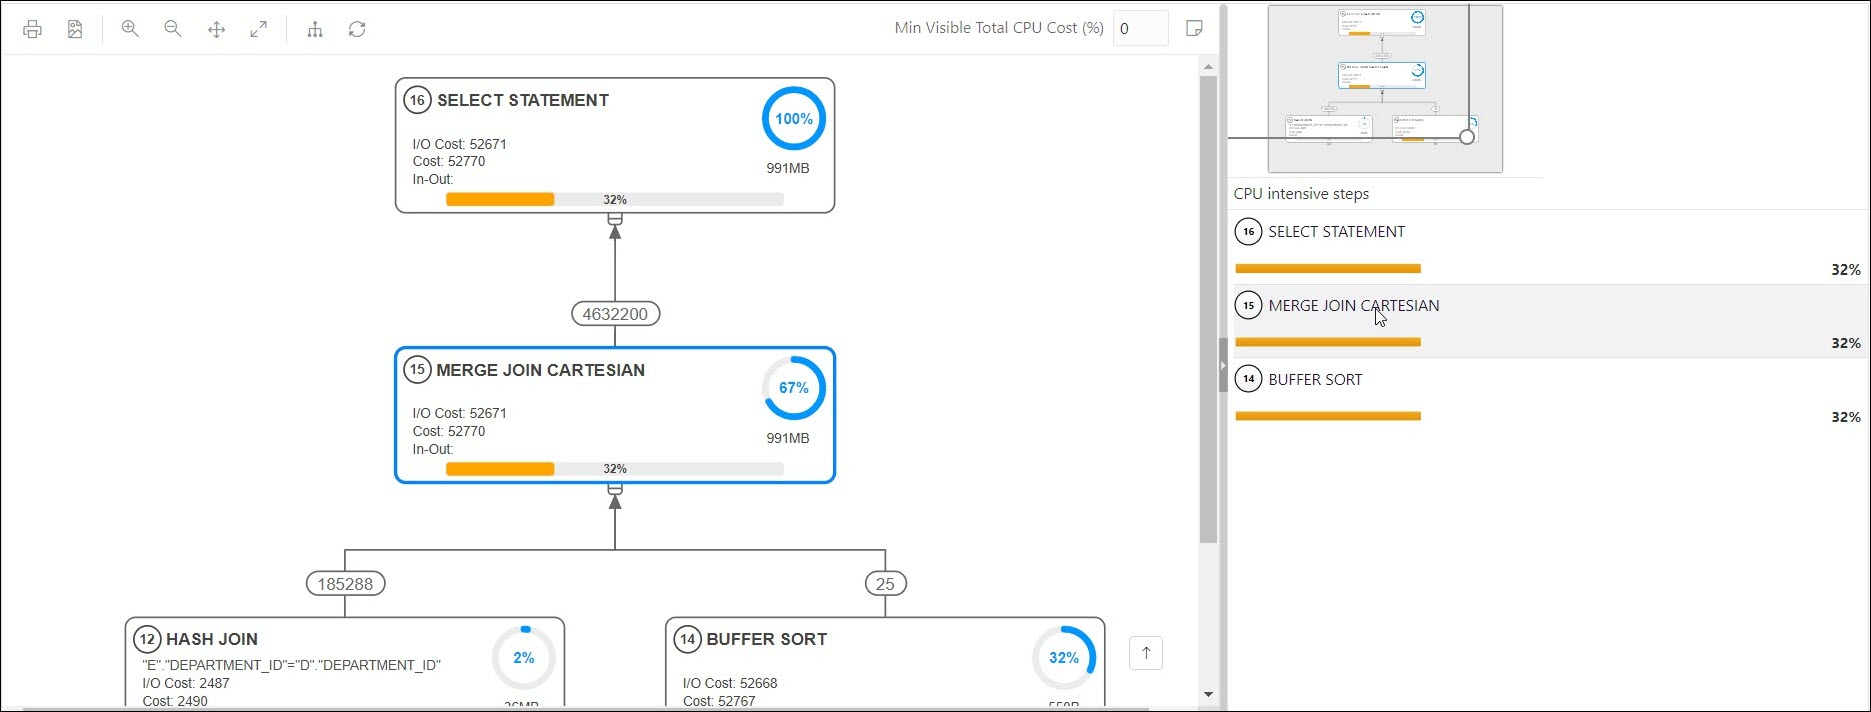
The Explain Plain diagram view is a graphical representation of the contents
of PLAN_TABLE, which is the default table for results of the EXPLAIN
PLAN statement. The hierarchical nature of the steps in the execution plan is depicted
in the diagram.
By default, three levels of steps are visible in the diagram. You can use the
+/- signs at the bottom of each step (available when the step
has children) to expand or collapse. To view all steps in the diagram, use ![]() Expand All in the toolbar.
Expand All in the toolbar.
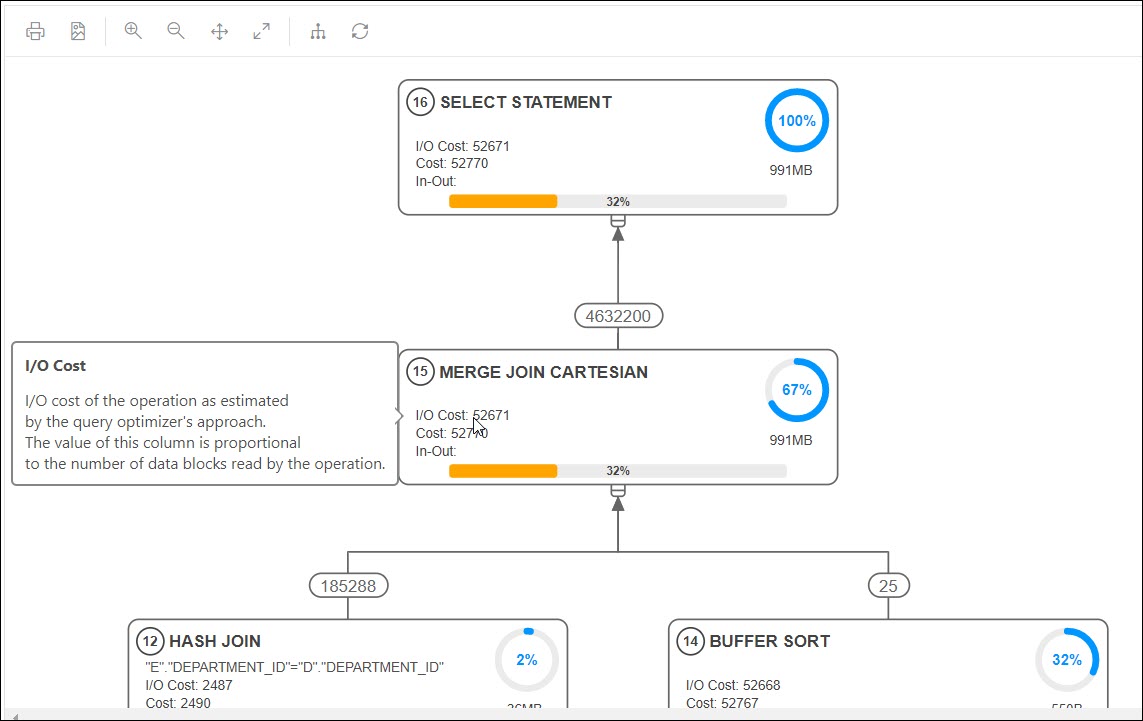
The diagram also provides the following details:
- Cardinality (number on the arrow to the parent step), which is the number of rows processed
- Operation and options applied in that step
- Execution order, which is the sequential number in the order of execution
- Access predicates CPU cost in percentage (orange bar)
- Total CPU cost for the step in percentage (blue circle)
- Estimated I/O Cost, Bytes processed and Cost metrics
You can see a brief description pop-up when you hover over any of these statistics in a step.
The icons in the toolbar are:
-
Advanced View: Displays data from
PLAN_TABLEin mixed tabular/tree view. There is a Diagram View icon that you can use to switch back to the diagram view. -
Print Diagram: Prints the diagram.
-
Save to SVG: Saves the diagram to file in SVG format.
-
Zoom In, Zoom Out: If a step is selected in the diagram, clicking the Zoom In icon ensures that it remains at the center of the screen.
-
Fit Screen: Fits the entire diagram in the visible area.
-
Actual Size: Sets the zoom factor to 1.
-
Expand All: Displays all steps in the diagram.
-
Reset Diagram: Resets the diagram to the initial status, that is, only three levels of steps are displayed.
-
Show Info: Shows the
SELECTstatement used by the Explain Plan functionality. -
Open in New Tab: Opens the diagram view in a new tab for better viewing and navigation. The diagram is limited to the initial SELECT statement.
-
Min Visible Total CPU Cost(%): Defines the threshold to filter steps with total CPU cost less than the the provided value.
Enter a value between 0 and 100. There is no filtering for 0.
-
Plan Notes: Displays the Explain Plan notes.
Properties
Double-click or press Enter on a selected step to open the Properties slider, which provides more information about that step. See PLAN_TABLE in Oracle Database Reference for a description of each property.
The Properties slider shows:
-
All information for that step extracted from
PLAN_TABLEin a tabular format. Nulls are excluded.You can select JSON to view the properties in JSON format.
-
Information from
OTHER_XMLcolumn ofPLAN_TABLE.The information is displayed in JSON format.
Navigation
-
Press the Tab key to move through the steps in the execution order. The selected step has a blue border around it.
To move in the reverse direction, press the Shift + Tab keys.
If no step is selected, pressing the Tab key selects the step with execution number 1.
-
Depending on the zoom level, use horizontal and vertical scrollbars to view different parts of diagram.
Click the left mouse button and hold it to pan the diagram around up and down.
Use the
 icon at the bottom right to scroll to the top of the diagram.
-
The Diagram Navigator is at the top right corner and represents a smaller copy of the diagram on a grey background. The rectangle border allows zoom-in and zoom-out operations and moves to show different parts of the diagram.
The diagram navigator shows a list with steps having more than 1% CPU cost in descending order. Click a step in the list to navigate to the same step in the diagram, enabling you to see it in the context of the other steps.
