8.5 Executing JavaScript Code Snippets and Debugging MLE Modules
You can add, edit, save and execute JavaScript code snippets using the Snippets tab in the right pane of the MLE JS page. Code snippets saved in the browser and file system are listed under the Snippet tab in the left pane.
JavaScript snippets can also be used to test and debug MLE modules using a debug specification. For more information about debug specifications, see Post-Execution Debugging in the JavaScript Developer's Guide.
Note:
SQL worksheet supports the execution of JavaScript code in Oracle Database release 21c. These saved JavaScript worksheets will also appear under the Snippets tab in the left pane.Executing a JavaScript Code Snippet
To execute a code snippet:
- In the right pane, select the
Snippet tab and enter the
JavaScript snippet.
You can do this in one of two ways:
- Type and enter the code, or copy and paste the code.
- Click Open File in the toolbar to browse and open the file that contains the code.
- Click the down arrow next to Snippet in the toolbar and select Save As. Enter a name for the code snippet and save.
- If required (such as when testing MLE modules), select the preferred environment.
- Click Run Snippet. The Output tab in the lower pane displays the results of the code execution.
Debugging a JavaScript MLE Module
To debug an MLE module:
- Enter the code snippet, save it and select the environment. See steps 1-3 in Executing a JavaScript Code Snippet.
-
In the Snippet toolbar, from the Debug Specification menu, click New Debug Specification.
The Create Debug Specification panel appears.
- In the Create Debug Specification panel, do the following:
- In the right side of the panel, select the module to debug.
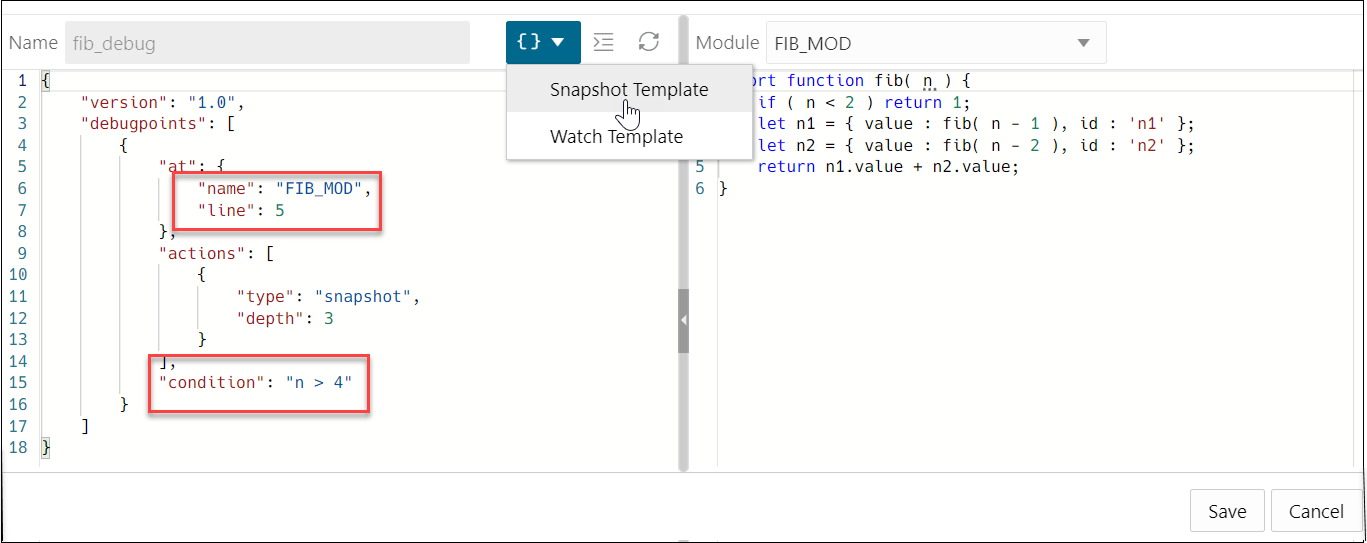
- In the left side of the panel, select the JSON template you want: Snapshot or Watch. For more information about these templates, see Debugpoint Actions in theJavaScript Developer's Guide.
- In the JSON template, the name of the MLE module
to debug is specified using the
namefield and the location within the module where the debug information is to be collected is specified using thelinefield. To specify the condition that will trigger the debug action, use theconditionfield. See Example: Debugging a JavaScript Module. - Click Create,
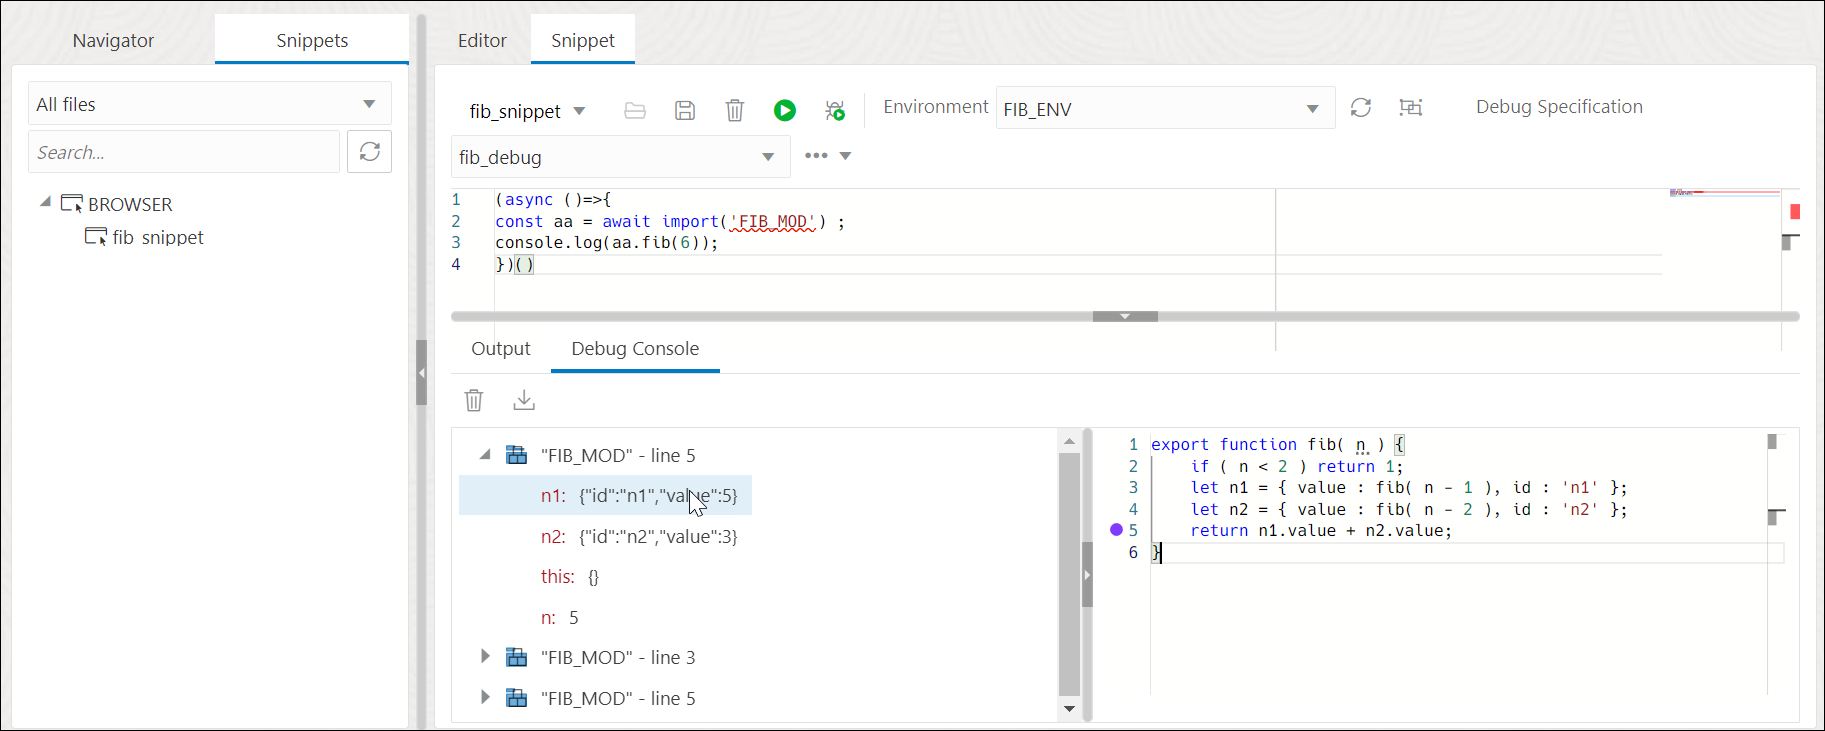
- In the MLS JS page, select the Snippet tab and in the Debug Specification field, select the created debug specification.
-
From the Snippet toolbar, click Debug Snippet.
The debug information appears under the Debug Console tab in the lower pane.
See Example: Debugging a JavaScript Module for an example of how to debug a JavaScript MLE module.

