Drafting Outlines
Now you can create the application and database and build the first draft of the outline in Essbase. The draft defines all dimensions, members, and consolidations. Use the outline to design consolidation requirements and identify where you need formulas and calculation scripts.
Note:
Outlines are a part of an Essbase database (or cube), which exists inside an Essbase application.
The TBC application designer issued the following draft for a database outline. In this plan, Year, Measures, Product, Market, Scenario, Pkg Type, and Ounces are dimension names. Observe how TBC anticipated consolidations, calculations and formulas, and reporting requirements. The application designers also used product codes rather than product names to describe products.
-
Year. TBC needs to collect data monthly and summarize the monthly data by quarter and year. Monthly data, stored in members such as Jan, Feb, and Mar, consolidates to quarters. Quarterly data, stored in members such as Qtr1 and Qtr2, consolidates to Year.
-
Measures. Sales, Cost of Goods Sold, Marketing, Payroll, Miscellaneous, Opening Inventory, Additions, and Ending Inventory are standard measures. Essbase can calculate Margin, Total Expenses, Profit, Total Inventory, Profit %, Margin %, and Profit per Ounce from these measures. TBC needs to calculate Measures on a monthly, quarterly, and yearly basis.
-
Product. The Product codes are 100‑10, 100‑20, 100‑30, 200‑10, 200‑20, 200‑30, 200‑40, 300‑10, 300‑20, 300‑30, 400‑10, 400‑20, and 400‑30. Each product consolidates to its respective family (100, 200, 300, and 400). Each consolidation allows TBC to analyze by size and package, because each product is associated with members of the Ounces and Pkg Type attribute dimensions.
-
Market. Several states make up a region; four regions make up a market. The states are Connecticut, Florida, Massachusetts, New Hampshire, New York, California, Nevada, Oregon, Utah, Washington, Louisiana, New Mexico, Oklahoma, Texas, Colorado, Illinois, Iowa, Missouri, Ohio, and Wisconsin. Each state consolidates into its region—East, West, South, or Central. Each region consolidates into Market.
-
Scenario. TBC derives and tracks budget versus actual data. Managers must monitor and track budgets and actuals, as well as the variance and variance percentage between them.
-
Pkg Type. TBC wants to see the effect that product packaging has on sales and profit. Establishing the Pkg Type attribute dimension enables users to analyze product information based on whether a product is packaged in bottles or cans.
-
Ounces. TBC sells products in different sizes in ounces in different markets. Establishing the Ounces attribute dimension helps users monitor which sizes sell better in which markets.
The following topics present a review of the basics of dimension and member properties and a discussion of how outline design affects performance.
Dimension and Member Properties
The properties of dimensions and members define the roles of the dimensions and members in the design of the multidimensional structure. These properties include the following:
-
Dimension types and attribute associations. See Dimension Types.
-
Data storage properties. See Member Storage Properties.
-
Consolidation operators. See Consolidation of Dimensions and Members.
-
Formulas. See Formulas and Functions.
For a complete list of dimension and member properties, see Setting Dimension and Member Properties.
Dimension Types
A dimension type is a property that Essbase provides that adds special functionality to a dimension. The most commonly used dimension types: time, accounts, and attribute. This topic uses the following dimensions of the TBC database to illustrate dimension types.
Database:Design
  Year (Type: time)
  Measures (Type: accounts)
  Product
  Market
  Scenario
  Pkg Type (Type: attribute)
  Ounces (Type: attribute)
The following table defines each Essbase dimension type.
Table 1-4 Dimension Types
| Dimension Types | Description |
|---|---|
|
None |
Specifies no particular dimension type. |
|
Time |
Defines the time periods for which you report and update data. You can tag only one dimension as time. The time dimension enables several accounts dimension functions, such as first and last time balances. |
|
Accounts |
Contains items that you want to measure, such as profit and inventory, and makes Essbase built-in accounting functionality available. Only one dimension can be defined as accounts. |
|
Attribute |
Contains members that can be used to describe members of another, so-called base dimension. For example, the Pkg Type attribute dimension contains a member for each type of packaging, such as bottle or can, that applies to members of the Product dimension. |
Member Storage Properties
You can specify data storage properties for members; data storage properties define where and when consolidations are stored. For example, by default, members are tagged as store data. Essbase sums the values of store data members and stores the result at the parent level.
You can change the default logic for each member by changing the data storage property tag for the member. For example, you can change a store data member to a label only member. Members with the label only tag, for example, do not have data associated with them.
The following table describes the effect that Essbase data storage properties have on members.
Table 1-5 Essbase Data Storage Properties
| Data Storage Properties | Effects on Members |
|---|---|
|
Store data |
Data for the member is stored in the database. Store data is the default storage property. |
|
Dynamic Calc |
The data associated with the member is calculated when requested by a user query. The calculated data is not stored; it is discarded after the query request is completed. |
|
Shared member |
The data associated with the member comes from another member with the same name. |
|
Label only |
Although a label only member has no data associated with it, a label only member can display a value. The label only tag groups members and eases navigation and reporting. Typically, label only members are not calculated. For example, in the Measures dimension, the member Ratios has three children, Margin%, Profit%, and Profit per Ounce. The member Ratios defines a category of members. When consolidated, Margin%, Profit%, and Profit per Ounce do not roll up to a meaningful figure for Ratios. Hence, Ratios is tagged as label only. |
Checklist for Dimension and Member Properties
-
Can you identify a time dimension?
-
Can you identify an accounts dimension?
-
Can you identify qualities or characteristics of dimensions that should be defined as separate attribute dimensions?
-
Which members require special data storage properties?
Designing an Outline to Optimize Performance
Position attribute dimensions at the end of the outline. Position dense dimensions before sparse dimensions.
The position of dimensions in an outline and the storage properties of dimensions can affect two areas of performance—how quickly calculations are run and how long it takes users to retrieve information.
See these topics to understand performance optimization basics:
Optimizing Query Performance
To optimize query performance, use the following guidelines when you design an outline:
-
If the outline contains attribute dimensions, ensure that the attribute dimensions are the only sparse Dynamic Calc dimensions in the outline.
-
In the outline, place the more-queried sparse dimensions before the less-queried sparse dimensions.
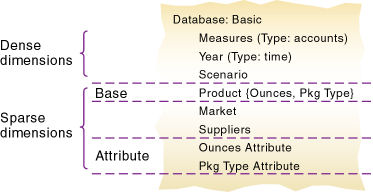
The outline illustrated below is designed for optimum query performance:
-
Because the outline contains attribute dimensions, the storage property for standard dimensions and all standard dimensions members is set as store data.
-
As the most-queried sparse dimension, the Product dimension is the first of the sparse dimensions. Base dimensions are typically queried more than other dimensions.
Figure 1-5 Designing an Outline for Optimized Query Times

Optimizing Calculation Performance
To optimize calculation performance, order the sparse dimensions in the outline by their number of members, starting with the dimension that contains the fewest.
See Designing for Calculation Performance.
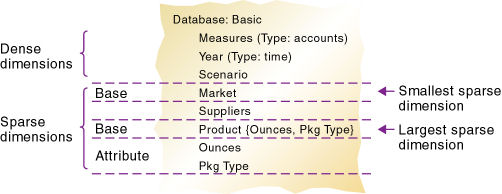
The outline illustrated below is designed for optimum calculation performance:
-
The smallest standard dimension that is sparse, Market, is the first of the sparse dimensions in the outline.
-
The largest standard dimension that is sparse, Product, is immediately above the first attribute dimension. If the outline did not contain attribute dimensions, the Product dimension would be at the end of the outline.
Figure 1-6 Designing an Outline for Optimized Calculation Times

Meeting the Needs of Both Calculation and Retrieval
Although they contain the same dimensions, the example outlines shown previously are different. To determine the best outline sequence for a situation, prioritize the data retrieval requirements of the users against the time needed to run calculations on the database. How often do you expect to update and recalculate the database? What is the nature of user queries? What is the expected volume of user queries?
A possible workaround is to initially position the dimensions in the outline to optimize calculation. After you run the calculations, you can manually resequence the dimensions to optimize retrieval. When you save the outline after you reposition its dimensions, choose to restructure the database by index only. Before you run calculations again, resequence the dimensions in the outline to optimize calculation.