2 Top Tasks for Oracle Essbase
Learn the most common administrative tasks in Essbase. Download sample application workbooks and use them to build cubes, provision users, and connect to Smart View for data analysis. Edit the cube outline by adding members. Run a calculation, export data, and explore cube designer.
Before you start working through these tasks, be sure that you can log in to Essbase and that Smart View and cube designer are installed on client computers. See Set up Cube Designer.
Download the Sample Dynamic Application Workbook and Examine Its Structure
In the Block Storage Sample (Dynamic) application workbook, all non-leaf level members in the cube are dynamically calculated. Dynamically calculated values are not stored in the cube; the values are recalculated and rendered for each user retrieval.
Download the Sample Dynamic Application Workbook
To download the Block Storage Sample (Dynamic) application workbook:
-
On the Applications page, click Files, then click
Gallery > Applications > Demo
              Samples > Block Storage
. -
On the Block Storage tab, click the Actions menu next to Sample_Dynamic_Basic.xlsx.
-
Save the application workbook file,
Sample_Dynamic_Basic.xlsx, to a local drive.
Examine the Structure of the Sample Dynamic Application Workbook
Application workbooks contain a number of worksheets that define the metadata for the cube, including an Essbase.Cube worksheet that names all of the dimensions in the cube and defines other information about them, separate worksheets for each dimension, and a data worksheet.
-
In Microsoft Excel, open
Sample_Basic_Dynamic.xlsx. -
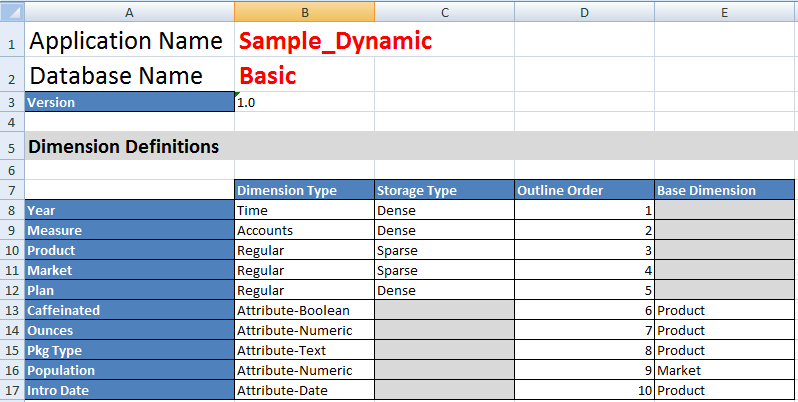
On the Essbase.Cube worksheet, the application name (Sample_Dynamic), cube name (Basic), the names of 10 dimensions, and other information about the dimensions, are defined.
-
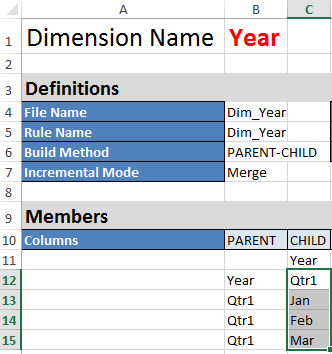
Each dimension has a separate worksheet, Dim.dimname, in which the dimension is further defined with information such as the build method and incremental mode. Because the build method for each dimension in this sample application workbook is PARENT-CHILD, members are defined in PARENT and CHILD columns.
On the Dim.Year worksheet, months roll up to quarters, and quarters roll up to years. For example, child members Jan, Feb, Mar roll up to parent member Qtr1. Child member Qtr1 rolls up to parent member Year.
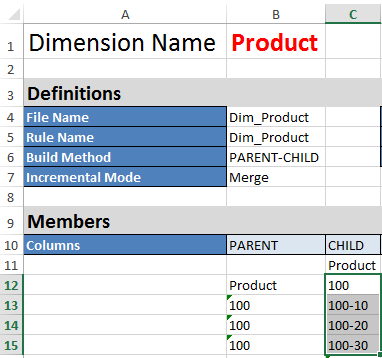
The Dim.Product and Dim.Market worksheets are similarly structured. In Dim.Product, SKUs roll up to product families, and product families roll up to Product. For example, child members 100-10, 100-20, and 100-30 (SKUs) roll up to parent member 100 (product family). Child member 100 rolls up to parent member Product.
-
This sample application workbook includes data. Scroll to the last worksheet, Data.Basic, to review the structure of the columns and the data.

In this topic, you learned how to download an application workbook and examine its structure. Next, learn how to access additional templates using the Gallery section of the File Catalog.
Create an Application in the Essbase Web Interface and Provision a User to Access and Query the Cube
In Download the Sample Dynamic Application Workbook and Examine Its Structure, you learned about the structure of an application workbook by exploring
Sample_Basic_Dynamic.xlsx.
Create an Application in the Essbase web interface
- In the Essbase web interface, on the Applications page, click Import.
- On the Import dialog box, click
File Browser (as the workbook was downloaded to the
local file system). Open the Block Storage Sample (Dynamic) application
workbook,
Sample_Basic_Dynamic.xlsx, that you saved in Download the Sample Dynamic Application Workbook and Examine Its Structure. - In Build Option, select Create
Database, and then check the box to load data. You do not need
to select Execute Scripts, because all measures and
aggregations along hierarchies in the cube are dynamically calculated at query
time.
Note:
In the Classic Web Interface, expand Advanced Options and Build Option, and then select to create a database and load data. - Click OK. In a few moments, the Sample_Dynamic application and Basic cube are created.
- Open the outline:
In the Redwood Interface,
- On the Applications page, open the Sample_Dynamic application, and open the cube, Basic.
- Click Launch Outline. The outline is a representation of the dimensions in the Basic cube as defined in the application workbook. The outline opens in a separate tab in the application window, allowing you to navigate between the outline and other web interface actions.
In the Classic Web Interface,- On the Applications page, expand the Sample_Dynamic application, and select the cube, Basic.
- In the Actions list for the cube, select Outline. The outline is a representation of the dimensions in the Basic cube as defined in the application workbook. The outline opens in a separate browser tab, allowing you to navigate between the outline and other web interface actions.
- View a cube dimension, and then drill down into the children of that
dimension:
- Expand the Year dimension to view the quarters.
- Expand the individual quarters to view months.
Now all of the information from the application workbook is represented in the new cube.
Provision a User to Access and Query the Cube
- Log in as a power user. This allows you to provision other users to the applications you have created.
- Go to Permissions.
In the Redwood Interface:
- On the Applications page, select the Sample_Dynamic application.
- Click Customization.
- Click Permissions and click
Add.
Note:
Clicking Add in this dialog does not allow you to add new users. Instead, you can add users that have already been provisioned using an identity provider. This topic assumes that you have users provisioned. There are several ways to provision Essbase users. See Manage Essbase User Roles and Application Permissions for independent deployments, or Manage Users and Roles for stack deployments. - Click the
 next to each user to assign their access.
- Click Close
 to close the list of users in the right hand panel.
In the Classic Web Interface:- Return to the Essbase web interface browser tab and go to Applications.
- Select the application for which you want to provision the user; in this example, select Sample_Dynamic. If you select the cube instead of the application, then you won't be able to provision user roles.
- Use the Actions menu to open the application inspector.
- Select the Permissions tab within the application inspector.
- Click
 to list users on the system, and click the
  next to each user to assign their access.
- Use the option controls next to each user to assign their access. Select Database Manager for each added user. The Database Manager has full control of the cube, but no control over the application.
In Analyze an Application in Smart View, you’ll go to Smart View, log in as the user you just provisioned, and then query a cube.
Analyze an Application in Smart View
In Create an Application in the Essbase Web Interface and Provision a User to Access and Query the Cube, you created an application and a cube with data, and provisioned users.
This task assumes that you installed Smart View. See Download and Run the Smart View Installer.
Connect to the Cube from Smart View
-
Open Microsoft Excel.
If Smart View is installed, the Smart View ribbon is displayed in Excel.
- On the Smart View ribbon, click Panel.
- On the Smart View Home dialog box, click the arrow next to the Home button, then select Private Connections.
- Make a private connection using the same URL that you used to
connect to Essbase, and append
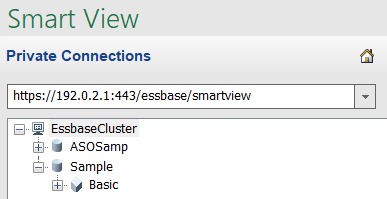
/essbase/smartviewto the end of that URL. For example,https://192.0.2.1:443/essbase/smartview. - Log in as the user you created.
- Expand EssbaseCluster.
-
Highlight the Basic cube, and click Connect.
Perform an Ad hoc Analysis
You can specify the ancestor position for a hierarchy as top or bottom, in the Member Options tab of the Options dialog in Smart View. SSANCESTORONTOP must first be enabled by an administrator in application configuration in the Essbase web interface. The grid changes shape when you perform a zoom-in operation. Here, just use the default bottom position.
- On the EssbaseCluster tree, under Sample_Dynamic, select the Basic cube, then click Ad hoc analysis.
- In the resulting grid, you can see one aggregated data value for
all five dimensions of this dynamic cube.

- Navigate into the member Scenario and narrow it down to a specific
scenario type of Actual data.
- Click the cell containing Scenario.
- On the Essbase ribbon, click Member Selection.
- In the Member Selection
dialog box, check the box next to the Actual member.

- Click Add
 to move Actual to the right pane.
- If Scenario is already included in the right pane, highlight it and use the left arrow to remove it, and then click OK.
On the Essbase ribbon, click Refresh. The grid should now look like this:

- Navigate into Measures and narrow it down to the Sales member, to
look at sales data.
- Highlight the cell containing Measures.
- On the Essbase ribbon, click Zoom In.
- Highlight the cell containing Profit, and click Zoom In..
- Highlight the cell containing Margin, and click Zoom In.
- Highlight the cell containing Sales, and click Keep Only.
The grid should now look like this:

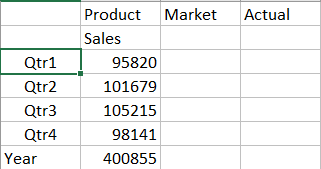
- Zoom in to Year by double-clicking the cell containing Year.
The grid should now look like this:
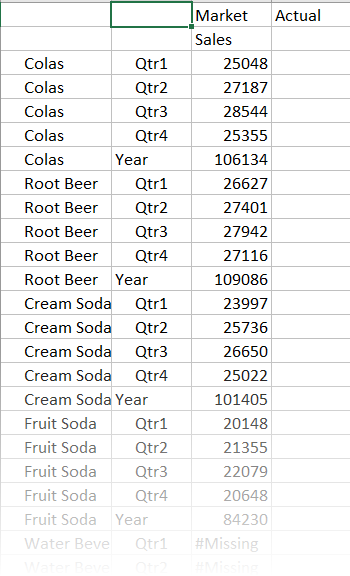
- Zoom in to Product by double-clicking the cell containing Product.
The grid should now look like this:
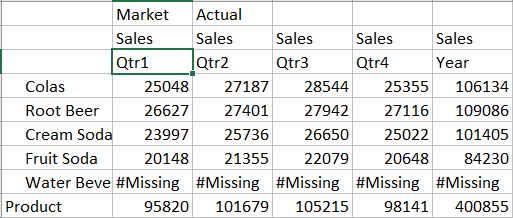
- Enhance your data display to show time periods per product. Pivot
Qtr1 of Colas by highlighting it, right-clicking and holding, then dragging it
from B3 to C3.
The grid should now look like this:
- Look at each product by region. Double-click Market in B1.
The grid should now look like this:
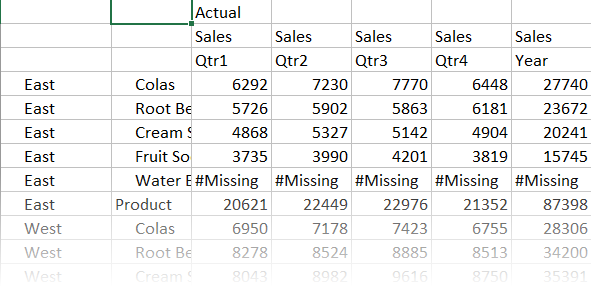
- Drill in to a region to view product sales by state. Double-click
East in A4.
Because not every product is sold in every state, some cells have the #Missing label instead of a data value.
In this task, you navigated through a data grid easily, zooming in and pivoting by clicking in the grid itself. You can also use the tools on the Essbase ribbon to perform the same actions. For more help on using Smart View, click the Smart View tab, and then click Help.
In Modify an Essbase Outline, you'll go back to the web interface and modify an outline.
Modify an Essbase Outline
In Analyze an Application in Smart View, you analyzed an application in Smart View.
Create a New Member
You start by creating a new member.
- In the Essbase web interface, from the Applications page, open the Sample_Dynamic application, then open the Basic database (cube).
- Click Launch Outline.
- If the outline is locked, click Unlock
outline
 .
.
- Click Edit outline
 .
.
- Expand the Scenario dimension.
- Select the Budget member.
- On the outline toolbar, under the Add member icon
 , select Add sibling member below.
- Enter the member name, Forecast, and press Add, and close the add member slider.
- Select the new Forecast member and select the tilde (~) consolidation operator from the list.
- Click Verify
 .
.
- Click Save outline
 .
.
- Choose a restructure database option, and click Save.
-
In the Essbase web interface, on the Applications page, select the Basic cube in the Sample_Dynamic application.
-
Click the Actions menu, and select Outline.
-
Click Edit.
-
Expand the Scenario dimension by clicking the arrow next to Scenario.
-
Insert a member:
-
Click Edit to put the outline in edit mode.
-
Expand the Scenario dimension.
-
Select the Budget member.
-
On the outline toolbar, under Actions, select Add a sibling below the selected member.
-
-
Enter the member name, Forecast, and press Tab.
-
Select the tilde (~) consolidation operator from the list.
The Forecast member does not aggregate with the other members in its dimension.
-
Leave the data storage type as Store Data because we want users to be able to input forecast data.
-
Click Save.
Seed the Forecast Member with Data
To seed the Forecast member with data, we'll create a calculation script and calculate forecast data.
- In the Essbase web interface, on the Applications page, open the Sample_Dynamic application, and open the Basic database (cube).
- Click Scripts, click Calculation Scripts, and click Create.
- In the Script Name field, enter
salesfcst. -
In the Script Content box, enter a simple formula:
Forecast(Sales=Sales->Actual*1.03;)Forecast for sales is equal to actual sales multiplied by 1.03, which seeds the Forecast member for Sales with a value 3% higher than the actual sales.
- Validate the script.
- Click Save and Close.
-
In the Essbase web interface, on the Applications page, select Basic cube in the Sample_Dynamic application, click the Actions menu, and select Inspect.
-
In the Basic dialog box, select the Scripts tab, with Calculation Scripts selected, click
 to add a calculation script.
-
In the Script Name field, enter
salesfcst. -
In the Script Content box, enter a simple formula:
Forecast(Sales=Sales->Actual*1.03;)Forecast for sales is equal to actual sales multiplied by 1.03, which seeds the Forecast member for Sales with a value 3% higher than the actual sales.
-
Click Save and Close.
-
Close the database inspector by clicking Close until all tabs are closed.
Execute the Script
Calculation scripts are executed as jobs.
- In the Essbase web interface, from the Applications page, click Jobs.
-
From the New Job drop-down menu, select Run Calculation.
-
On the Run Calculation dialog box, in the Application field, select Sample_Dynamic application.
Notice that the Database field automatically populates the Basic cube.
-
On the Scripts menu, select the salesfcst calculation script that you created.
-
Click Submit.
-
Click Refresh to see that the job completes.
In Analyze Forecast Data in Smart View, you'll analyze this new forecast data in Excel. But first, let’s take a closer look at managing jobs.
Analyze Forecast Data in Smart View
In Analyze an Application in Smart View, you learned to analyze data in Smart View. In Modify an Essbase Outline, you added a Forecast member to the outline, and seeded it with data.
Now you'll reconnect to the cube in Smart View, and do further analysis of the data.
- Open Excel and create a worksheet like the following one, by typing the member names in these cells: A3=Market, B3=Product, C1=Year, C2=Actual, D1=Sales, D2=Forecast.

-
On the Smart View ribbon, reconnect to Basic cube in the Sample_Dynamic application.

Your previous connection URL should be shown in the list of Private Connections.
- When prompted to log in, connect as the user you provisioned.
- To populate cells with data values, click Ad hoc analysis.
In the resulting grid, you should be able to see the results of your calculation. The yearly sales data refreshes for both Actual and Forecast, and the forecast is about 3% higher than the actual:

- To test that the calculation is correct, create this Excel formula, =D3/C3, in cell E3, which divides the forecast data by the actual data, to ensure that D3 is 3% higher than C3.

The test result should confirm the 3% increase, in which Actual is 400511, Forecast is 412526.3, and E3 is 1.0.

- Zoom in on Product and Market. You can see that for all products and all markets, the forecast data is present and is 3% higher than the actual.
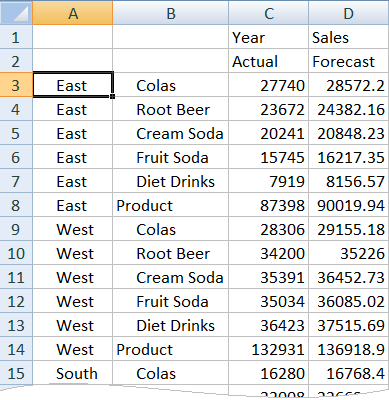
- Now, build a worksheet that you will use to do a data analysis on the forecast, and make some changes.
- Click the cell containing Forecast, then click Keep Only.
- Select cells A3-B3 containing East and Colas, then click Keep Only.
The grid should now look like this:

- With cells A3-B3 still selected, click Zoom In to view per-state information for detailed product SKUs.
The grid should now look like this:

- Pivot the Year dimension down into the columns. Highlight member
Year, and select the arrow next to
zoom in on the Essbase ribbon. Select Zoom to bottom to
see the bottom level of the months.
The grid should now look like this:

- Enter some monthly values to create a Diet Cola forecast. For example, enter 500 in each of the cells in the range C5:H5.

- Click Submit Data, and notice that the full year forecast in cell O5 changes to 3000, which is the sum of 500 in each of 6 months.
In this task, you learned how easy it is to analyze and edit the cube in Smart View, as long as you have the correct provisioning.
In Create an Application and Cube in Cube Designer, you’ll get familiar with Cube Designer.
Create an Application and Cube in Cube Designer
In Analyze Forecast Data in Smart View, you analyzed data in Excel. Users working in Excel can design and deploy applications using cube designer.
Open the Application Workbook in Cube Designer
Log in as a Power User and download the Sample_Basic.xlsx application workbook from the Gallery.
-
In Excel, on the Cube Designer ribbon, click Catalog
 .
.
If you are prompted to log in, then log in as a Power User.
-
Click Gallery, then navigate to
Applications > Demo Samples > Block Storage, and double-click Sample_Basic.xlsx.
The Sample Basic application workbook is different from the Sample Basic Dynamic application workbook in that the Product and Market dimensions do not have dynamically calculated members.
For example, go to the Dim.Market worksheet in
Sample_Basic.xlsx. Look at the Storage
column. There are no X characters, which indicates that the members are stored. X
characters in the Storage column indicate dynamically
calculated members.
Therefore, after creating the dimensions and loading the data, you also need to calculate the cube.
Creating, loading, and calculating the cube can all be done in one step in the Build Cube dialog box.
Create, Load, and Calculate the Cube
Use Cube Designer to create, load, and calculate a cube from the
Sample_Basic.xlsx application workbook.
-
On the Cube Designer ribbon, with the Sample Basic application workbook (
Sample_Basic.xlsx) still open, click Build Cube .
.
-
On the Build Option menu, select Create Cube.
-
Click Run.
If there is an existing application with the same name, you are prompted to overwrite the application and cube. Click Yes to delete the original application and build this new application.
-
Click Yes to confirm your selection.
The View Jobs icon displays an hourglass while the job is in progress. The job runs in the background, and Cube Designer notifies you when the job is completed, which should display Success.
-
Click Yes to launch the Job Viewer and see the status of the job.
View the Application in the Web Interface
View and inspect the new application in the Essbase web interface, check that both level zero and upper-level blocks exist to confirm that the cube is fully calculated.
In the Redwood Interface:
- Log into the Essbase web interface.
- Open the Sample application, and then open the Basic cube.
- Click Launch Outline.
View the outline, and see that the expected dimensions are present.
- Return to the Basic cube tab.

- On the General page, under Statistics, you see that both level 0 and upper-level blocks exist, showing that the cube is fully calculated.
In the Classic Web Interface:
-
Log into the Essbase web interface.
-
On the Applications page, expand the Sample application and select the Basic cube.
-
Click the Actions menu to the right of the Basic cube and select Outline.
View the outline, and see that the expected dimensions are present.
-
Return to the Applications page, expand the Sample application, and select the Basic cube.
-
Click the Actions menu to the right of the Basic cube and select Inspect.
-
In the inspector, select Statistics.
-
On the General tab, in the Storage column, you see that both level 0 and upper-level blocks exist, showing that the cube is fully calculated.
In Analyze Data and Perform an Incremental Update in Cube Designer, you'll analyze data in this cube and perform incremental updates from Excel.
Analyze Data and Perform an Incremental Update in Cube Designer
In Create an Application and Cube in Cube Designer, you executed a cube build, loaded data, and ran the calculation script defined in the workbook.
Analyze Data in the Sample Basic Cube
Validate that the cube build was successful and see how to analyze data.
-
In Excel, on the cube designer ribbon, click Analyze
 .
.
-
On the Analyze menu, select Connect Query Sheets.
If you are prompted to log in, then enter your Essbase user name and password.
-
You’re connected to the Basic cube in the Sample application.
-
You can now analyze the data.
-
Use the Essbase ribbon to zoom in on Cream Soda to see all of the low-level products that are part of the Cream Soda family.
-
Zoom out on New York to see all of the East region, and zoom out again to see all Markets.
-
Perform an Incremental Update on the Sample Basic Cube
Add a hierarchy to the product dimension and see the results in Smart View.
-
Go to the Dim.Product worksheet, where you’ll update the product dimension with some extra products.
-
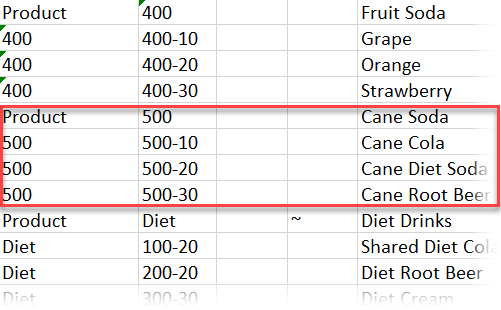
Insert new members into the workbook, following the 400 product family.
-
Create a new parent Product with child 500 and give it the Alias Default name Cane Soda.
-
Create three new SKUs with parent 500: 500-10, 500-20, and 500-30.
-
Give aliases to the new SKUs. Call them Cane Cola, Cane Diet Cola, and Cane Root Beer.
-
-
Save the updated workbook.
-
Using the cube designer ribbon, click Build Cube
 .
.
The build option will default to Update Cube – Retain All Data since the application already exists on the server and you are the application owner who created it.
-
Click Run.
-
When the job completion notice is displayed, click Yes to launch the Job Viewer.
-
You should see Success. If the job returns Error, then you can double-click the job for more information.
-
Close the Job Viewer.
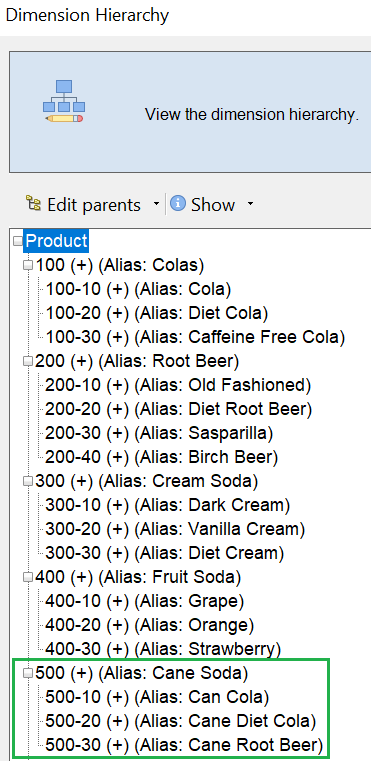
- With the Dim.Product sheet active, click Hierarchy Viewer in the cube designer ribbon.
- On the Dimension Hierarchy dialog box, see that
the Cane Soda product group was created.
-
Go to the query worksheet, Query.Sample.
-
Navigate to the top of the Product dimension by highlighting Dark Cream and zooming out using the Essbase ribbon. Then zoom out on Cream Soda.
-
Select Product again and click Zoom In.
-
Select Cane Soda and click Keep Only.
-
Select Cane Soda and Zoom In to see the child members.
Adding members to the Product dimension does not populate those members with data. Data can be submitted using Smart View or by performing a data load.
Application workbooks are convenient tools for designing Essbase cubes when you already understand the elements needed to build a cube or when you have a sample.
In Transform Tabular Data into a Cube, you will create an application using a columnar Excel worksheet without any Essbase-specific structure.
Transform Tabular Data into a Cube
Data from external source systems such as ERP tables or data warehouse are not formatted as an application workbook. You can still use cube designer to build a cube from it.
In Export and Modify Metadata and Data, you’ll create a hierarchy for these Measures so that you can see Revenue net of Discounts, and total costs (fixed and variable).
Export and Modify Metadata and Data
In Transform Tabular Data into a Cube, you created an application and cube from tabular data.