Quick Start - Lightweight Monitoring Stack
This example quick start project deploys a lightweight monitoring stack using Prometheus (metrics collection) and Grafana (dashboards/visualization) via Docker Compose.
The quick start project is available here.
What is deployed?
-
Prometheus exposed on host port 10000
-
Grafana exposed on host port 3000
-
Docker volumes are created for persistent data unless removed during teardown
Prerequisites
-
Docker and Docker Compose installed
-
Ensure host ports 10000 and 3000 are not already in use
Start the Stack
-
From the project root (where
compose.yamlis located), run:docker compose up -d -
Verify containers and port mappings:
docker psExpected port mappings:
-
Grafana: 0.0.0.0:3000->3000/tcp
-
Prometheus: 0.0.0.0:10000->10000/tcp
-
Start the Storage Nodes with metrics enabled and Prometheus port configured
Example 1 - Start the Storage Nodes with Metrics Enabled:
java -Dkvinsight.enable=true -Dprometheus.http.port=8000 -jar lib/kvstore.jar start -root $KVROOTFor more details, see Enable and Configure KVInsight.
You can now see the metrics exposed on port 8000.
Figure 1 - Raw Metrics Exposed to Prometheus
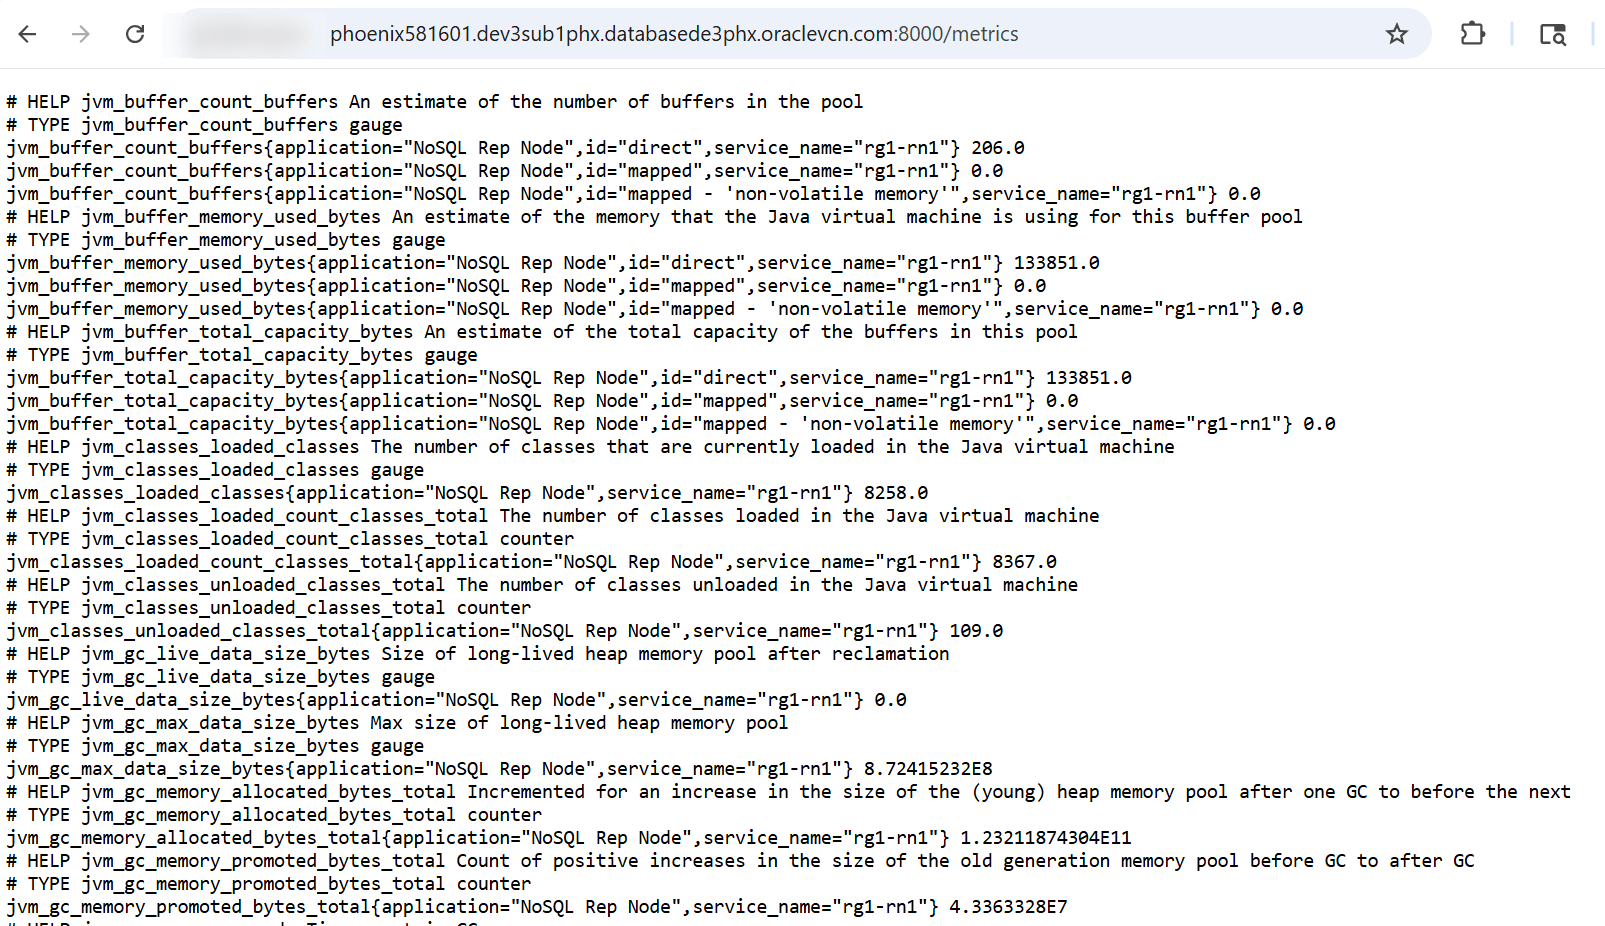
This shows the raw Prometheus /metrics endpoint (plain text), which is what Prometheus scrapes to build Grafana dashboards and alerts. Each metric includes a short help text, a type (for example, gauge and counter), and labels like application and service_name to show which node or service it came from.
Access the web interfaces
-
Prometheus UI:
http://localhost:10000The default Prometheus configuration expects the data store to expose metrics at:
http://<host>:8000/metrics, where <host> is the host running the data store. If metrics are exposed on a different port, or you have multiple Storage Nodes on different hosts/ports, update the scrape targets in$KVHOME/monitoring/prometheus-grafana/prometheus/prometheus.yml. For more details on this, see Integration with Prometheus.You can view the metrics in Prometheus as shown below:
Figure 2 - KVInsight Metrics in Prometheus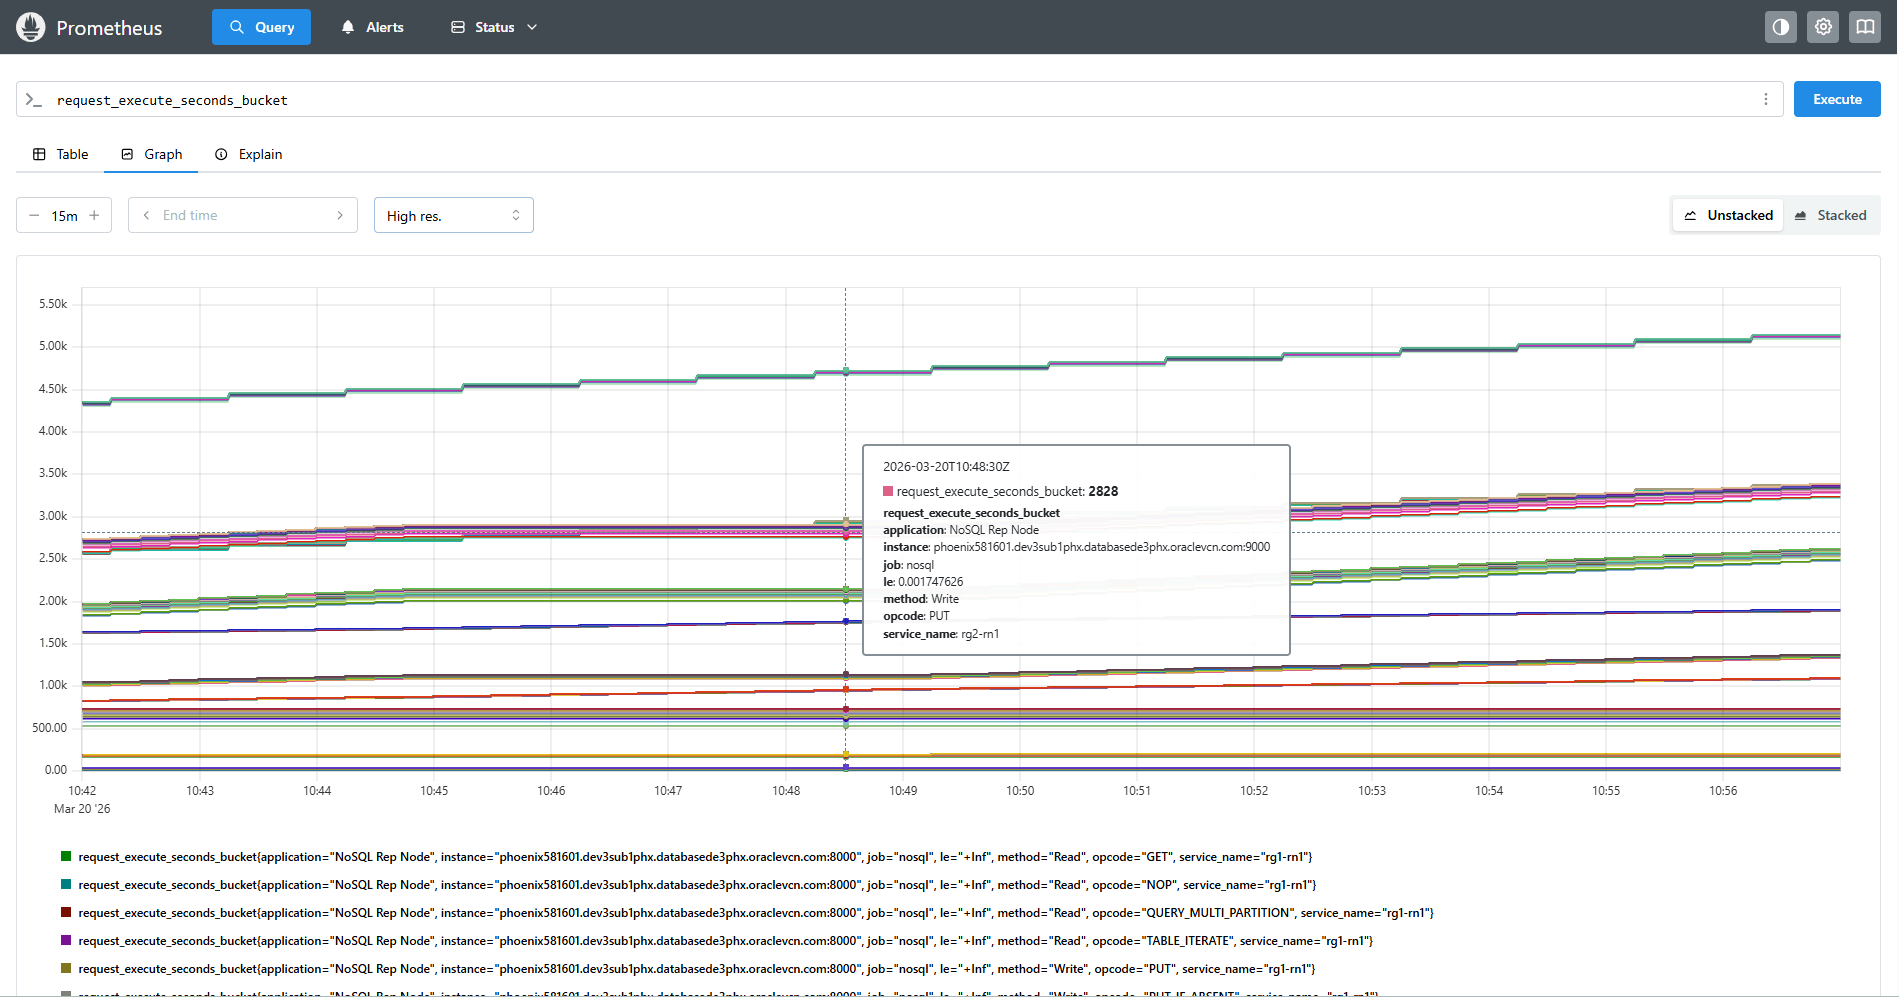
For example, the chart above shows the number of requests handled, grouped by request type, and how many were completed within each latency threshold (“bucket”). Histogram bucket series are cumulative counters, so the lines rise over time; a steeper rise indicates higher traffic. The
+Infbucket represents all requests. By comparing the lower-latency buckets to+Inf, you can see whether most requests are completing quickly or whether a larger share is falling into slower response times. -
Grafana UI:
http://localhost:3000-
Log in using the credentials defined in
compose.yaml -
Grafana is pre-configured with Prometheus as the default data source
-
Import the provided dashboards (
overview.json,JVM.json,requests_per_node.json) to quickly visualize the metrics. -
You can visualize the metrics in the dashboards
Figure 3 - Sample Grafana Dashboard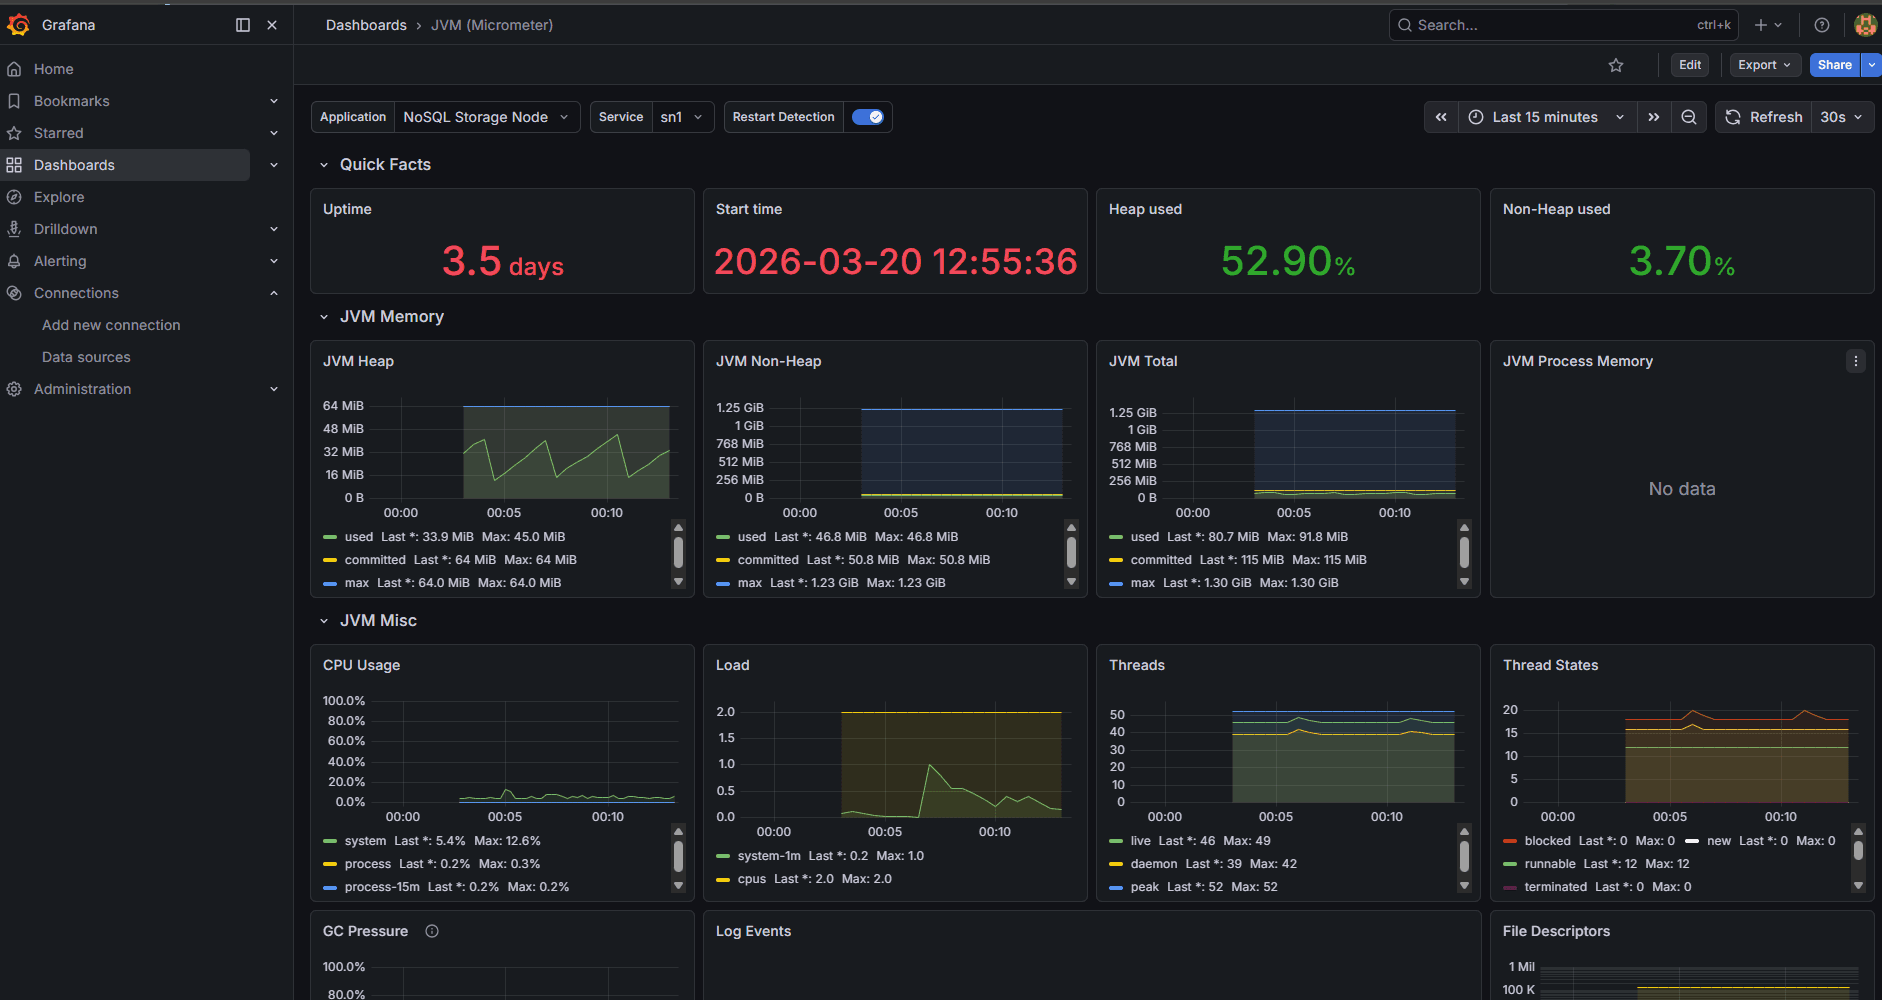
The above Grafana dashboard is a quick health view of the JVM running the NoSQL Storage Node. It shows uptime/start time (helps spot restarts), heap vs non-heap memory usage (whether the JVM is approaching memory limits), and trends for CPU, system load, thread counts/states, and garbage-collection pressure (signals of performance stress). You can use it to tell if the process is stable and whether the resources are trending toward saturation or abnormal behavior.
-
Figure 4 - Request Overview Dashboard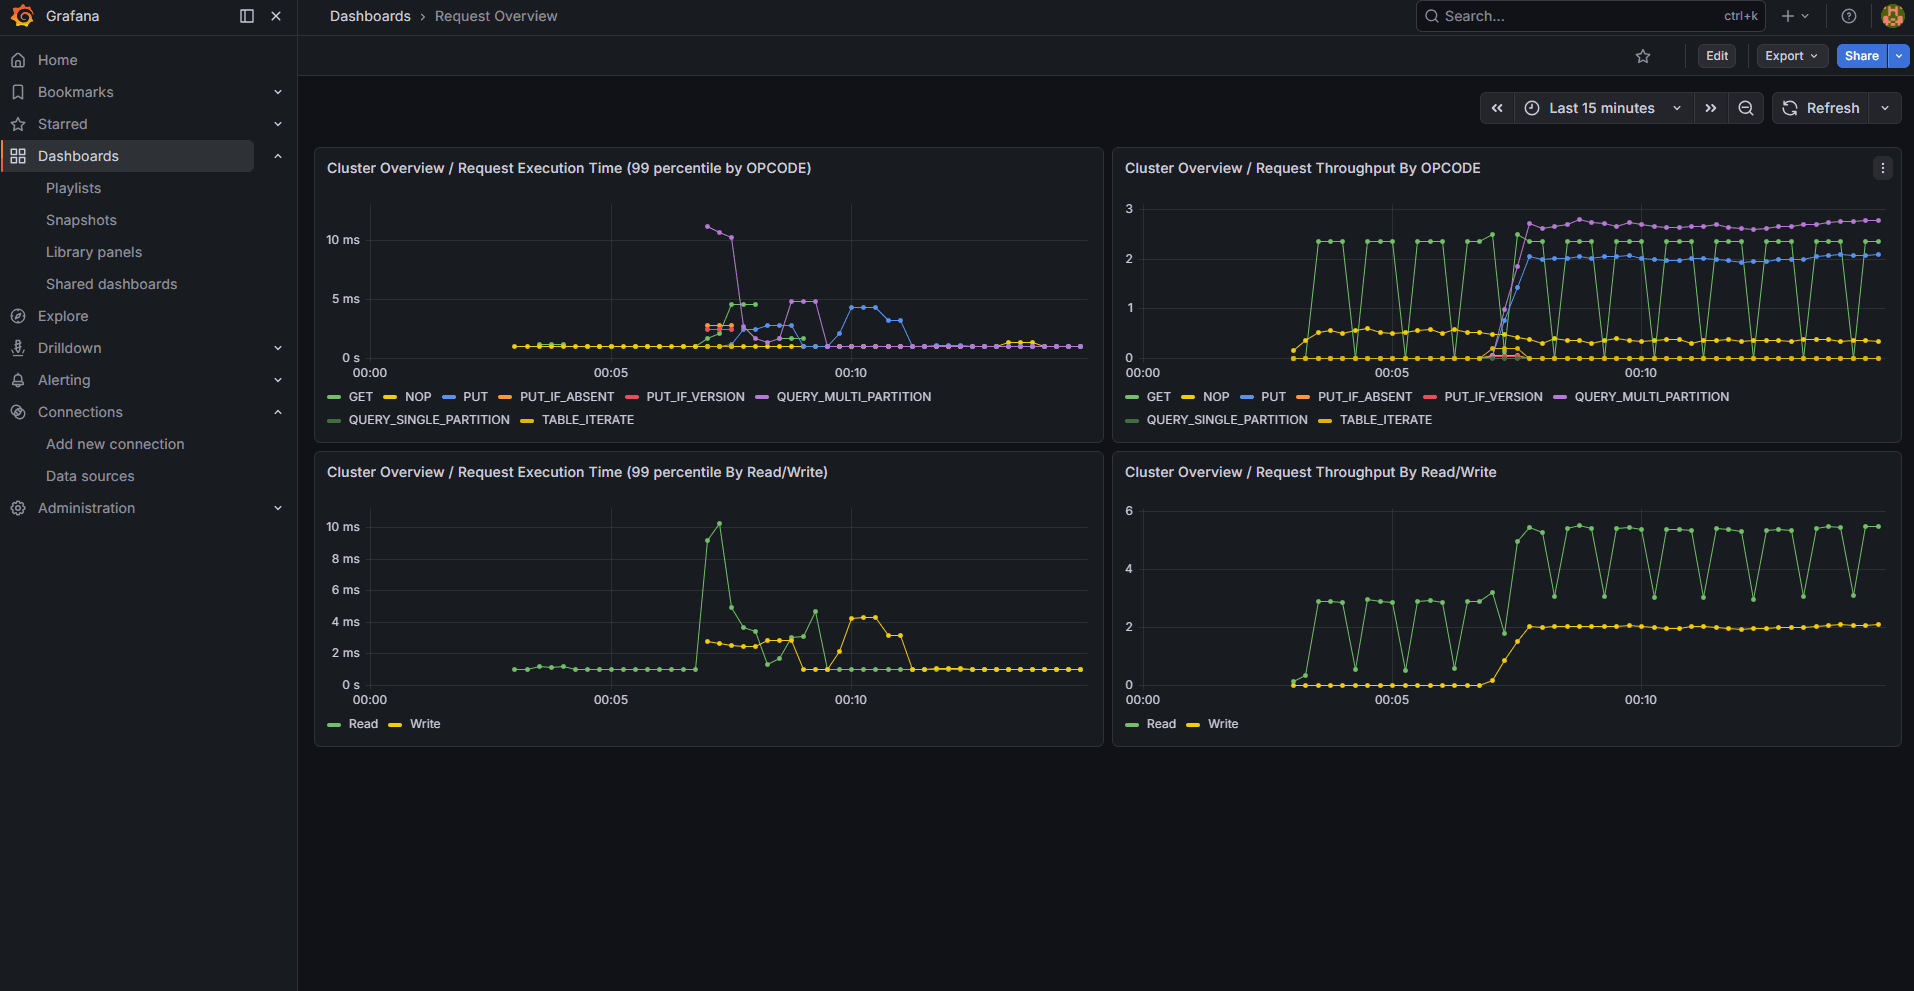
The
Request Overviewdashboard summarizes request latency and load across the cluster. The charts on the left show p99 request execution time, broken down by operation (GET/PUT/query) and by Read vs. Write, helping you identify which request types are slowing down. The charts on the right show throughput (requests/sec) with the same breakdowns, so you can correlate load spikes with latency increases and see whether the issue is read-heavy, write-heavy, or specific to an operation type.
-
Stop and remove the stack
-
Stop and remove containers:
docker compose down -
Stop and remove containers and volumes (erases stored data):
docker compose down -v