ttStats in TimesTen Classic
In TimesTen Classic, the ttStats utility can perform the following functions:
-
Monitor and display database performance metrics in real-time, calculating rates of change during each preceding interval.
-
Collect and store snapshots of metrics to the database then produce reports with values and rates of change from a specified pair of snapshots. (These functions are performed through calls to the
TT_STATSPL/SQL package.)
The ttStats utility gathers metrics from TimesTen Classic system tables, views, and built-in procedures. In reports, this includes information such as a summary of memory usage, connections, and load profile, followed by metrics (as applicable) for SQL statements, transactions, PL/SQL memory, replication, logs and log holds, checkpoints, cache groups, latches, locks, XLA, and TimesTen connection attributes. Monitoring displays a smaller set of key data, as shown later in this section.
For TimesTen Client DSNs, use the ttStatsCS version of the utility.
Note:
Although cross-release compatibility over client/server protocol is supported in TimesTen, the tool ttStatsCS is not backward and forward release compatible; hence it can be used only for the same version client/server connections.
There are three modes of operation:
-
Monitor mode (default mode): Tracks database performance in real-time by monitoring a pre-determined set of metrics, displays those metrics (primarily those whose values have changed since the last display), and calculates rates of change in the values where appropriate. Information is output to the standard output for display to the user and is not stored to disk.
If the duration or number of iterations is not specified, the monitoring runs until interrupted with
Ctrl-C.Note:
The set of metrics displayed in monitor mode is subject to change, depending on changes to the system tables and built-in procedures from which metrics are gathered.
-
Snapshot mode: Takes a snapshot of metrics, according to the capture level, and stores them to database
SYS.SNAPSHOT_XXXXsystem tables. Once the snapshot is taken, its ID number is displayed to the standard output. The capture level applies only to metrics fromSYS.SYSTEMSTATS. For metrics from other sources, the same data are collected regardless of the capture level.By default, a "typical" set of metrics is collected, which suits most purposes, but you can specify a reduced "basic" set of metrics, all available metrics, or only those metrics from sources other than
SYSTEMSTATS. -
Report mode: Generates a report from two specified snapshots of metrics. Reports are in HTML format by default, but you can request plain text format. You can specify an output file or display output to the standard output. For those familiar with Oracle Database performance analysis tools, the
ttStatsreports are similar in nature to Oracle Automatic Workload Repository (AWR) reports.
In monitor mode, the overhead of reading from the database is avoided. In snapshot mode and report mode, the ttStats utility is a convenient front end to the TT_STATS PL/SQL package provided by TimesTen. Refer to TT_STATS in Oracle TimesTen In-Memory Database PL/SQL
Packages Reference for details on that package.
Do not use this utility if you are connecting to TimesTen through a driver manager.
Required Privilege
-
Monitor mode: No special privilege is required to run monitor mode, but
ADMINprivilege is required for the monitoring information to include data from thettSQLCmdCacheInfobuilt-in procedure andtransaction_log_api(XLA) table. -
Snapshot and report mode: By default, only the instance administrator has privilege to run in snapshot or report mode, due to security restrictions of the
TT_STATSPL/SQL package. Any other user, including anADMINuser, must be grantedEXECUTEprivilege for theTT_STATSpackage by the instance administrator or by anADMINuser, such as in the following example:GRANT EXECUTE ON SYS.TT_STATS TO scott;
Syntax
These are the supported name/value pairs:
ttStats [-h | -help]
ttStats [-V | -version]
ttStats [-monitor] [-interval seconds]
        [-duration seconds] [-iterations count]
           {DSN | -connStr connection_string}
ttStats  -snapshot [-level capture_level] [-description snap_desc]
           {DSN | -connStr connection_string}
ttStats  -report [-snap1 snapid1 -snap2 snapid2]
         [-html | -text] [-outputFile filename]
           {DSN | -connStr connection_string}
ttStats  -drop [-begin_snap snapid1 [-end_snap snapid2]]
           {DSN | -connStr connection_string}
Note:
Specify only one of -monitor, -snapshot, or -report.
Options
These are the supported options for the ttStats utility in TimesTen Classic:
| Option | Description |
|---|---|
|
|
Prints the list of options and exits. Note: This is also the result if nothing is entered on the |
|
|
Prints the TimesTen release number and exits. |
|
|
Run in real-time monitor mode. Monitors a pre-determined set of metrics and repeatedly displays the metrics and rates of change. Unlike in snapshot mode, nothing is stored to the database. Note: This is the default mode if neither |
|
|
For monitor mode, this is the time interval between sets of metrics that are displayed, in seconds. The default is 10 seconds. Shorter intervals may negatively impact system performance. |
|
|
For monitor mode, this is the duration of how long Also see information for the |
|
|
For monitor mode, this is the number of iterations Note: If you specify both |
|
|
Collect a snapshot of metrics according to the capture level and store the metrics in the database. Once the snapshot is captured, its ID number is displayed. Notes:
|
|
|
For snapshot mode, this is the level of metrics to capture. The possible settings are as follows:
Use the same level for any two snapshots to be used in a report. Notes:
|
|
|
For snapshot mode, optionally use this to provide any description or notes for the snapshot, for example to distinguish it from other snapshots. |
|
|
Generate a report from two specified snapshots, in HTML format by default. Use snapshots taken at the same capture level. Notes:
|
|
|
For report mode, this is the snapshot ID of the first snapshot. |
|
|
For report mode, this is the snapshot ID of the second snapshot. |
|
|
For report mode, optionally specify a file path and name where the report is to be written. If no file is specified, TimesTen writes the to the standard output. |
|
|
For report mode, specify HTML or plain text output format. Note: It is not necessary to specify |
|
|
Delete snapshots in the range specified by This option is useful to keep the snapshot storage under the limit of 255 snapshots in the database. |
|
|
For the |
|
|
For the If |
|
or
|
To specify and connect to the database from which to gather metrics, do one of the following:
See Specifying Data Source Names to Identify TimesTen Databases in Oracle TimesTen In-Memory Database Operations Guide for information about TimesTen DSNs. |
Examples
This section
provides examples of ttStats monitoring and report output.
Note:
Examples are for illustrative purposes only. Details are subject to change.
Monitor Example
This section shows sample output from monitor mode.
% ttStats database1

Connected to TimesTen Version 22.1.1.21.0 TimesTen Cache version 22.1.1.21.0

Waiting for 10 seconds for the next snapshot
Description                          Current  Rate/Sec  Notes
date.2021-Feb-20 16:49:25      -869676175380467200           1  sample #, not rate
connections.count                         12
db.size.temp_high_water_mark.kb         7153       7
lock.locks_granted.immediate             832       1
log.log_bytes_per_transaction              0
loghold.bookmark.log_force_lsn    0/12027904
loghold.bookmark.log_write_lsn    0/12050944
loghold.checkpoint_hold_lsn       0/12025856                  database1.ds0
loghold.checkpoint_hold_lsn       0/12023808                  database1.ds1
stmt.executes.count                       44       1
stmt.executes.selects                     32       1
Note:
The number following the date and time is a numeric representation of the time of the snapshot and can be ignored.
The following command line example specifies that monitoring should stop after two iterations and uses a connection string to set a connection attribute value.
% ttStats -iterations 2
-connStr "DSN=database1;PLSQL_MEMORY_ADDRESS=20000000"
Snapshot Example
The following examples take two snapshots at the default typical level:
% ttStats -snapshot database1

Connected to TimesTen Version 22.01.0001.0021 TimesTen Cache version
22.1.1.21.0.
Snapshot 1 at TYPICAL level was successfully captured.

% ttStats -snapshot database1

Connected to TimesTen Version 22.1.1.21.0 TimesTen Cache version 22.1.1.21.0
Snapshot 2 at TYPICAL level was successfully captured.
Report Examples
The following example creates a report from the snapshots generated in the previous section.
% ttStats -report -outputFile testreport.html -snap1 1 -snap2 2 database1

Connected to TimesTen Version 22.01.0001.0021 TimesTen Cache version 22.1.1.21.0.
Report testreport.html was created.
The rest of this section shows excerpts from tables of metrics that a
ttStats report generates. This output was produced using the default HTML
format.
Note:
Examples are not shown for SWT cache group metrics, local cache group metrics, dynamic global cache group metrics, grid metrics, or latch metrics.
To include latch metrics, you must enable them for the database, using the
ttXactAdmin utility as follows:
% ttXactAdmin -latchstats on DSN
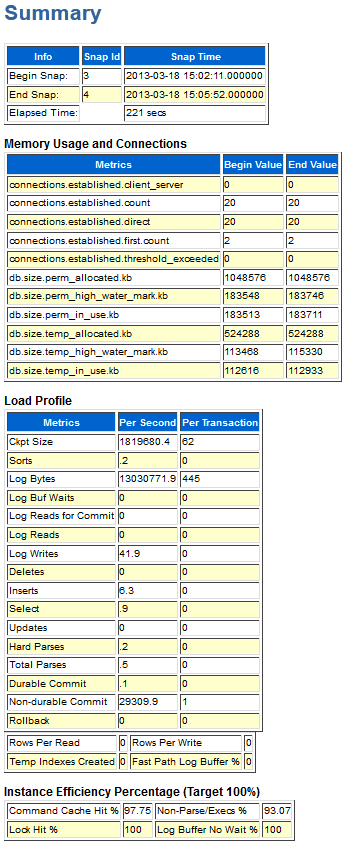
Figure 5-1 shows most of a report summary. The summary is good for a quick look at database metrics, with further details provided in the subsequent tables. It includes the following sections:
-
Memory Usage and Connections: This information includes information about memory usage (the
db.sizemetrics) and connections established (theconnections.establishedmetrics), including the number of client/server connections and direct connections. Any nonzero value forconnections.established.threshold_exceeded, indicates too many connections. -
Load Profile: This gives an idea of the workload, showing the number of checkpoints, sorts (such as for
ORDER BYstatements), log buffer waits (delays when the log buffer fills and flushes to disk), inserts, updates, deletes, parses (such as for prepares), commits, and rollbacks. Consider whether there may be too many parses or too many durable commits (which are more expensive than non-durable commits). -
Instance Efficiency Percentage:
Command Cache Hit %,Non-Parse/Execs %,Lock Hit %, andLog Buffer No Wait %are shown. All should be near 100%.-
Lock Hit %estimates the percentage of lock requests that are granted without waiting. -
Non-Parse/Execs %represents the percentage of SQL statement executions that do not require a prepare or reprepare. -
Command Cache Hit %estimates the percentage of executions of SQL commands that can be found in the command cache. -
Log Buffer No Wait %estimates the percentage of log insertions that do not have to wait due to log buffer waits.
-
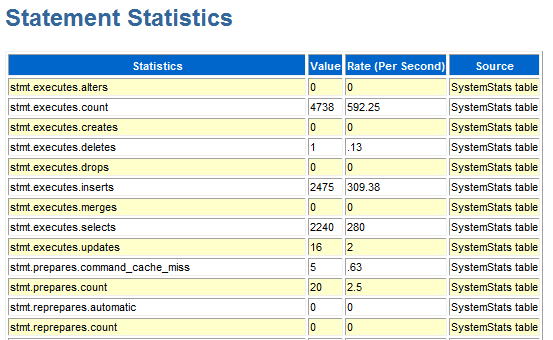
Figure 5-2 shows statement metrics from a report. Both
external metrics (stmt.executes, stmt.prepares, and
stmt.reprepares metrics) and internal metrics
(zzinternal metrics) are shown. External metrics are generally of more
interest. The stmt.executes.count value is the sum of all the other
stmt.executes values.
Figure 5-2 ttStats report: statement statistics
Description of "Figure 5-2 ttStats report: statement statistics"
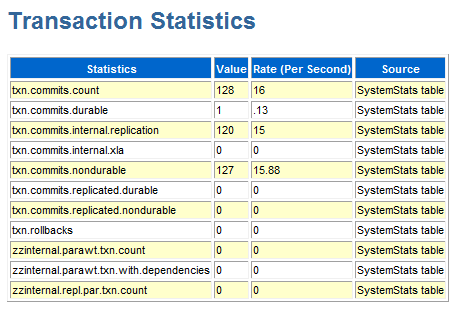
Figure 5-3 shows transaction metrics from a report. The
txn.commits.count value is the sum of the
txn.commits.durable and txn.commits.nondurable values.
Other metrics shown are subsets of these metrics.
Figure 5-3 ttStats report: transaction statistics
Description of "Figure 5-3 ttStats report: transaction statistics"
Figure 5-4 shows an excerpt of SQL execution metrics from the SQL Statistics section of a report. When you look at the "sort by executions" metrics and "sort by preparations" metrics (shown in the next section), note which statements are used a lot and the number of preparations and the number of executions for each statement. Ideally, a statement is not prepared many times.
Figure 5-4 ttStats report: SQL execution statistics
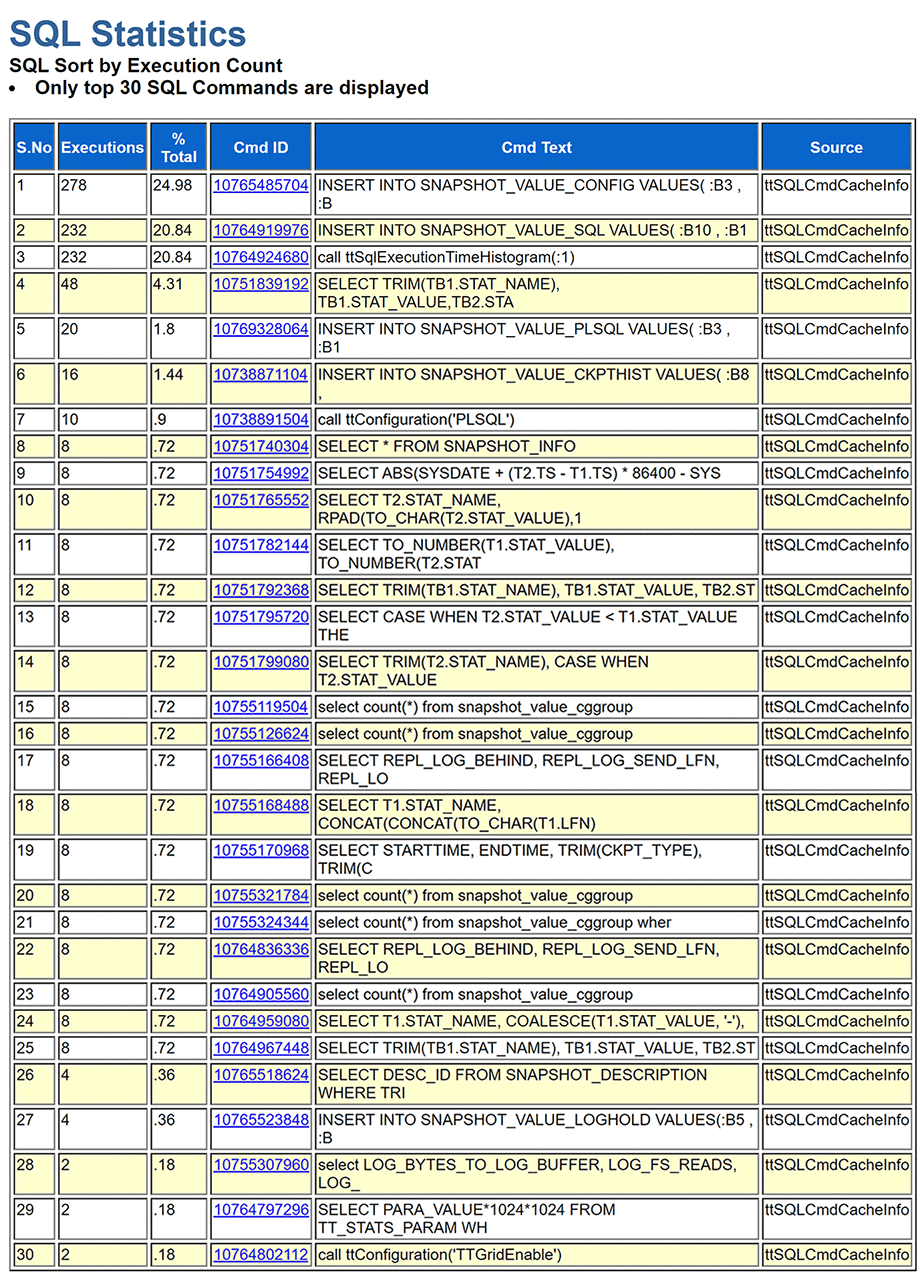
Description of "Figure 5-4 ttStats report: SQL execution statistics"
Figure 5-5 shows an excerpt of SQL preparation metrics from the SQL Statistics section of a report. Refer to the discussion in the preceding "sort by executions" section.
Figure 5-5 ttStats report: SQL preparation statistics
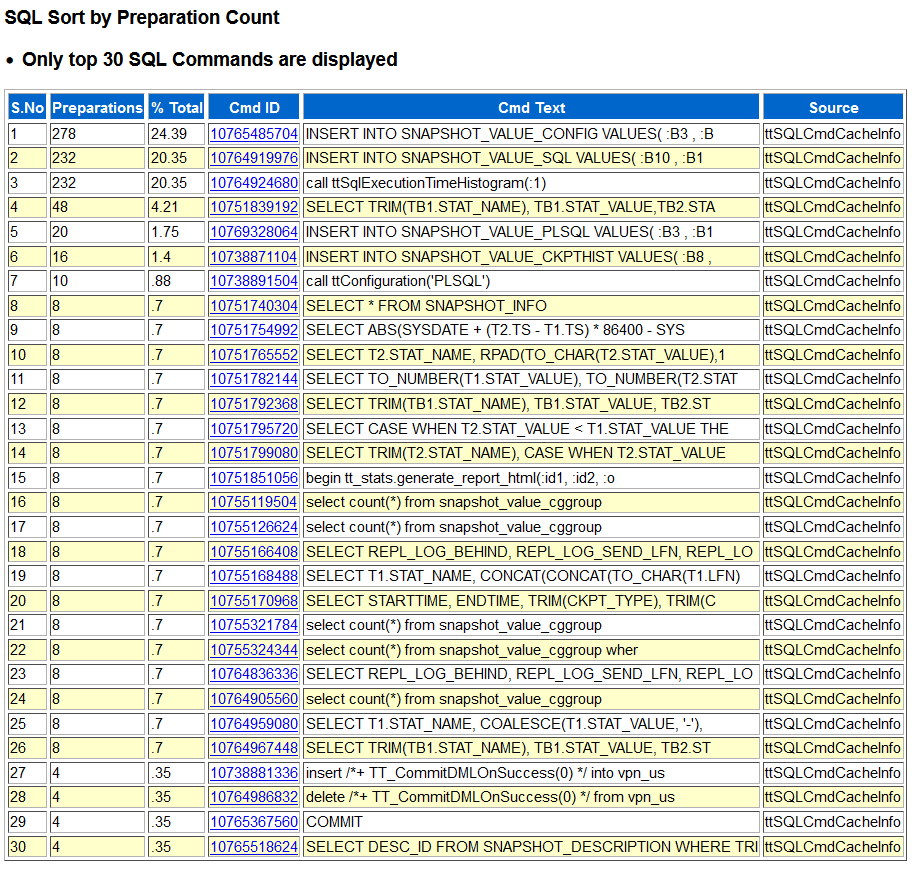
Description of "Figure 5-5 ttStats report: SQL preparation statistics"
Figure 5-6 shows an excerpt of SQL statements from the SQL Statistics section of a report. This report shows the complete text of each statement listed in the preceding "sort by executions" and "sort by preparations" reports, where longer statements are abbreviated.
Figure 5-6 ttStats report: SQL command texts
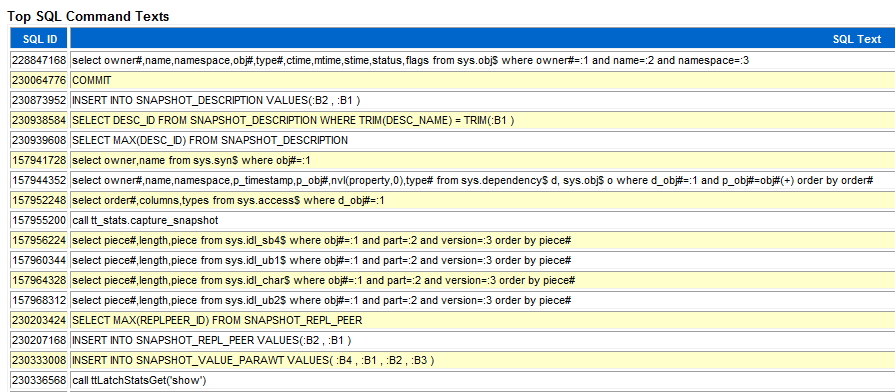
Description of "Figure 5-6 ttStats report: SQL command texts"
Figure 5-7 shows PL/SQL memory metrics from a report. These
are metrics from the ttPLSQLMemoryStats built-in procedure. There should
not be a significant difference between the start and end values of
GetHitRatio or PinHitRatio.
Figure 5-7 ttStats report: PL/SQL memory statistics
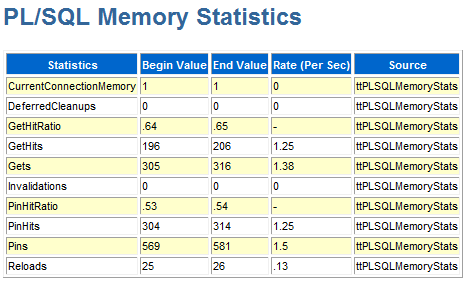
Description of "Figure 5-7 ttStats report: PL/SQL memory statistics"
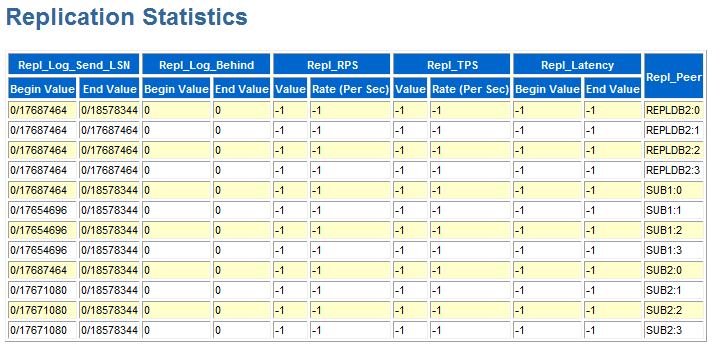
Figure 5-8 shows replication metrics from a report. For each
transmitter (where there could be multiple transmitters per master), the metrics indicate
advancement through the log, including how many records were sent to the receiver.
Repl_Peer indicates the subscriber. Repl_Log_Behind and
Repl_Latency are significant in indicating whether replication is keeping
up with the database workload.
Figure 5-8 ttStats report: replication statistics
Description of "Figure 5-8 ttStats report: replication statistics"
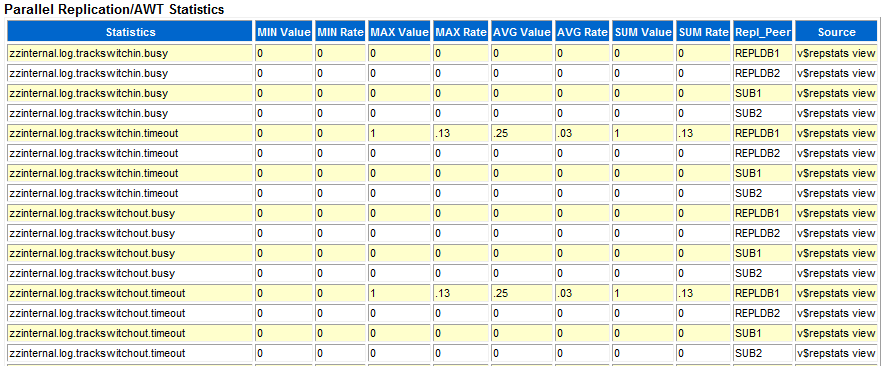
Figure 5-9 shows an excerpt of parallel replication/AWT
metrics from a report. Repl_Peer indicates the subscriber. When parallel
replication/AWT is configured, if replication metrics (discussed in the previous section)
indicate difficulty keeping up with the workload, parallel replication/AWT metrics may
indicate why. Each value is an aggregate across all tracks, but you can click Show
Details (at the end of the metrics table, not shown here) to see the data for each
track. High values for track switching—"switchin" and "switchout" metrics—may indicate
contention. High values for "waits" metrics are also problematic, indicating situations such
as one transaction having to wait for a previous transaction to commit before it can begin
or before it can commit.
Figure 5-9 ttStats report: parallel replication/AWT statistics
Description of "Figure 5-9 ttStats report: parallel replication/AWT statistics"
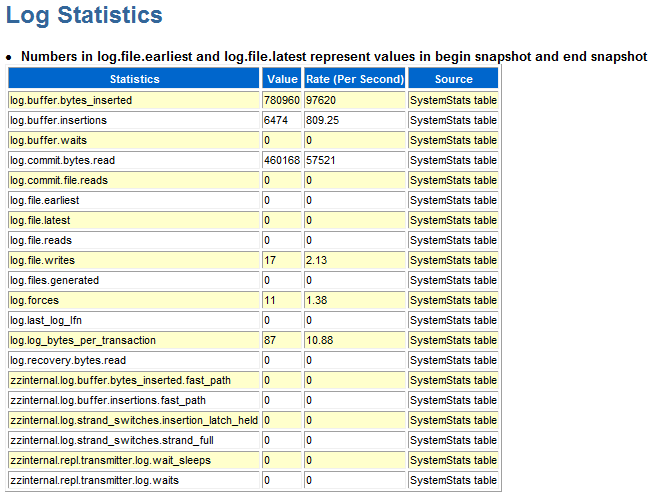
Figure 5-10 shows log metrics from a report. The report output
notes that numbers in log.file.earliest and
log.file.latest represent values in the begin and end snapshots. The
log.buffer.waits metric is of particular interest. Log buffer waits occur
when application processes cannot insert transaction data to the log buffer and must stall
to wait for log buffer space to be freed. The usual reason for this is that the log flusher
thread has not cleared out data fast enough. This may indicate that log buffer space is
insufficient, disk bandwidth is insufficient, writing to disk is taking too long, or the log
flusher is CPU-bound. (Also see Managing Transaction Log Buffers and Files and Configure Log Buffer and
Log File Size Parameters in Oracle TimesTen In-Memory Database Operations
Guide.)
Figure 5-10 ttStats report: log statistics
Description of "Figure 5-10 ttStats report: log statistics"
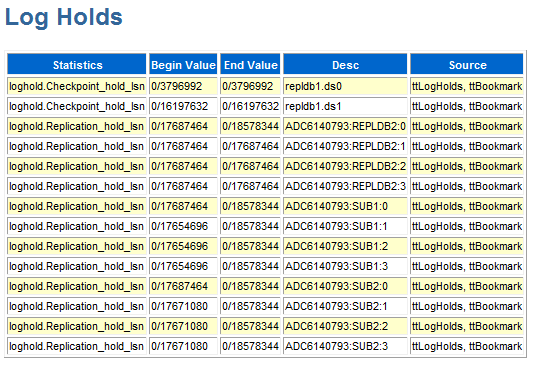
Figure 5-11 shows log hold information from a report. It shows bookmark positions for checkpoint log holds for each checkpoint file, and bookmark positions for replication log holds for each replication subscriber. This report may also show log hold information for backup, XLA, and long-running transactions. Where the begin and end values are the same, there have been no movements.
Ideally there will be
evidence of a smooth progression through the log file. (The ttStats monitor
information may be more useful in tracking this.)
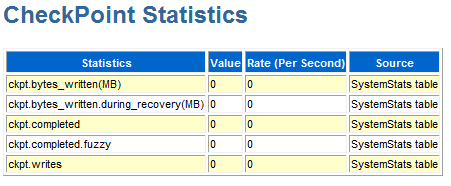
Figure 5-12 shows checkpoint metrics from a report.
Figure 5-12 ttStats report: checkpoint statistics
Description of "Figure 5-12 ttStats report: checkpoint statistics"
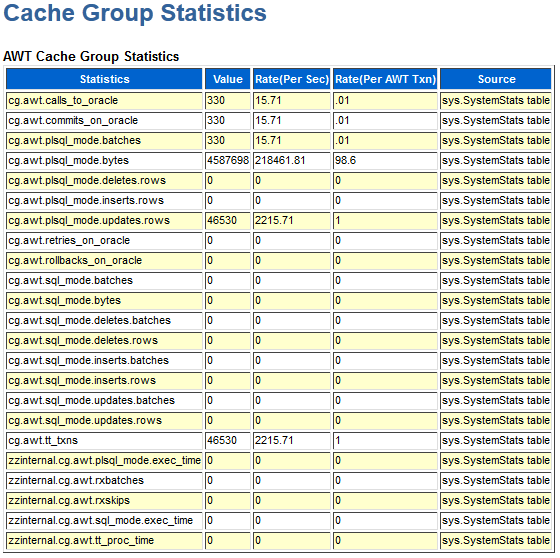
Figure 5-13 shows AWT cache group metrics from a report. Values are aggregates across all AWT cache groups. Information includes the number of calls to the Oracle database; the number of commits, rollbacks, and retries on Oracle; and the number of rows inserted, deleted, and updated by PL/SQL operations and by SQL operations.
Figure 5-13 ttStats report: AWT cache group statistics
Description of "Figure 5-13 ttStats report: AWT cache group statistics"
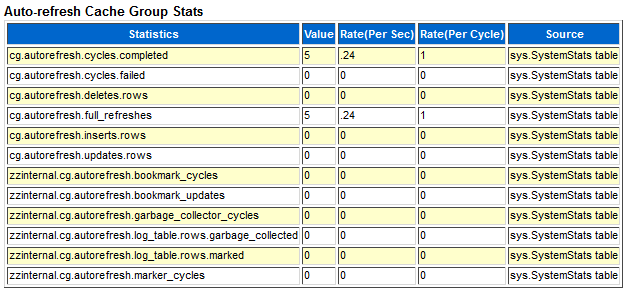
Figure 5-14 shows auto-refresh cache group metrics from a
report. Values are aggregates across all auto-refresh cache groups. Whether cache groups are
in full or incremental refresh mode is reflected by the
cg.autorefresh.full_refreshes value with respect to the
cg.autorefresh.cycles.completed value (which indicates the total number
of refreshes).
Figure 5-14 ttStats report: auto-refresh cache group statistics
Description of "Figure 5-14 ttStats report: auto-refresh cache group statistics"
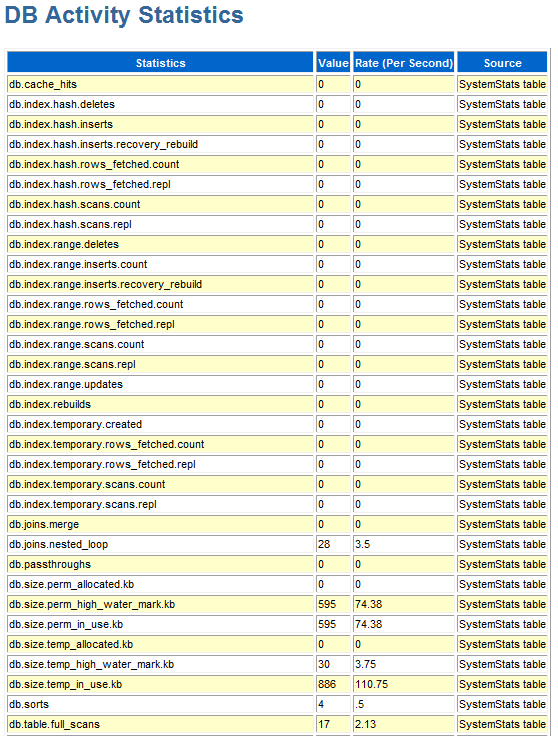
Figure 5-15 shows an excerpt of database activity metrics from a report—index activity, memory activity, and table activity. For hash indexes and range indexes, information includes deletes, inserts, rows fetched, and scans. For memory usage, it shows size data. For tables, it shows rows read, deleted, inserted, and updated.
Figure 5-15 ttStats report: database activity statistics
Description of "Figure 5-15 ttStats report: database activity statistics"
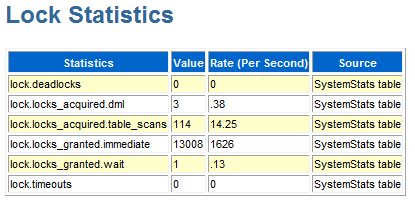
Figure 5-16 shows lock metrics from a report. This provides
information about deadlocks, locks acquired, locks granted, and lock timeouts. In
particular, lock.deadlocks, lock.locks_granted.wait, and
lock.timeouts may indicate lock contention.
Figure 5-16 ttStats report: lock statistics
Description of "Figure 5-16 ttStats report: lock statistics"
Figure 5-17 shows XLA bookmark information from a report. For
each bookmark, the begin and end values are shown for Purge_LSN, which
indicates the position in the log file prior to which information has been purged, and for
Log_Behind, which indicates whether there is a lag between the position
of the XLA transaction and the position of the most recent log file.
Figure 5-17 ttStats report: XLA information

Description of "Figure 5-17 ttStats report: XLA information"
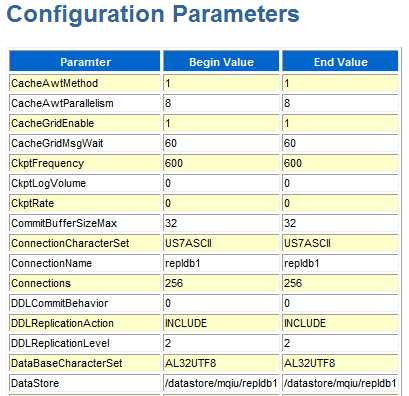
Figure 5-18 shows database configuration parameter settings from a report. For reference, each report shows the begin and end values of each TimesTen connection attribute.
For information about connection attributes, see Connection Attributes.
Figure 5-18 ttStats report: configuration parameters
Description of "Figure 5-18 ttStats report: configuration parameters"
See Also
