6.1.1 Automatic Workload Repository (AWR)
AWR is the integrated performance diagnostic tool built into Oracle Database. AWR includes Exadata storage server configuration, health, and statistics information.
AWR collects information from various database dynamic performance views at regular intervals. Each data collection is an AWR snapshot. An AWR report shows statistics captured between two AWR snapshots.
AWR collects and reports a wealth of statistical data related to Oracle
Database, including database statistics and wait events from V$SYSSTAT,
V$SYSTEM_EVENT, V$SEGMENT_STATISTICS,
V$SQL.
Commencing with Oracle Database release 12.1.0.2, AWR also collects performance statistics from Exadata storage servers and includes them in the HTML version of the AWR report. Consequently, AWR provides comprehensive and unified performance information that includes Oracle Database statistics and Exadata statistics, storage metrics, and alerts from all storage servers.
Note:
The Exadata sections are only available in the HTML version of the AWR report.
The AWR report contains the following Exadata-specific sections:
Key benefits include:
- AWR provides comprehensive and unified performance information that includes Oracle Database metrics and Exadata storage metrics and alerts from all storage servers.
- AWR enables simple outlier detection and analysis.
- The granularity of AWR information is customizable and based on the AWR collection interval, which is hourly by default.
It is important to note that the Exadata storage server statistics are collected and maintained by the storage servers, so the information is not restricted to a specific database or database instance. Consequently, the storage related statistics in AWR includes the I/O for all databases running on the storage servers, while the database statistics relate to the specific instance or database hosting AWR.
When using a container database (CDB), the Exadata-specific sections of the AWR report are only available in the root container.
As part of Oracle Database, AWR is constantly being enhanced with new statistics and analysis. The availability of a specific section or statistic is subject to the version of Oracle Database being used.
Exadata Server Configuration
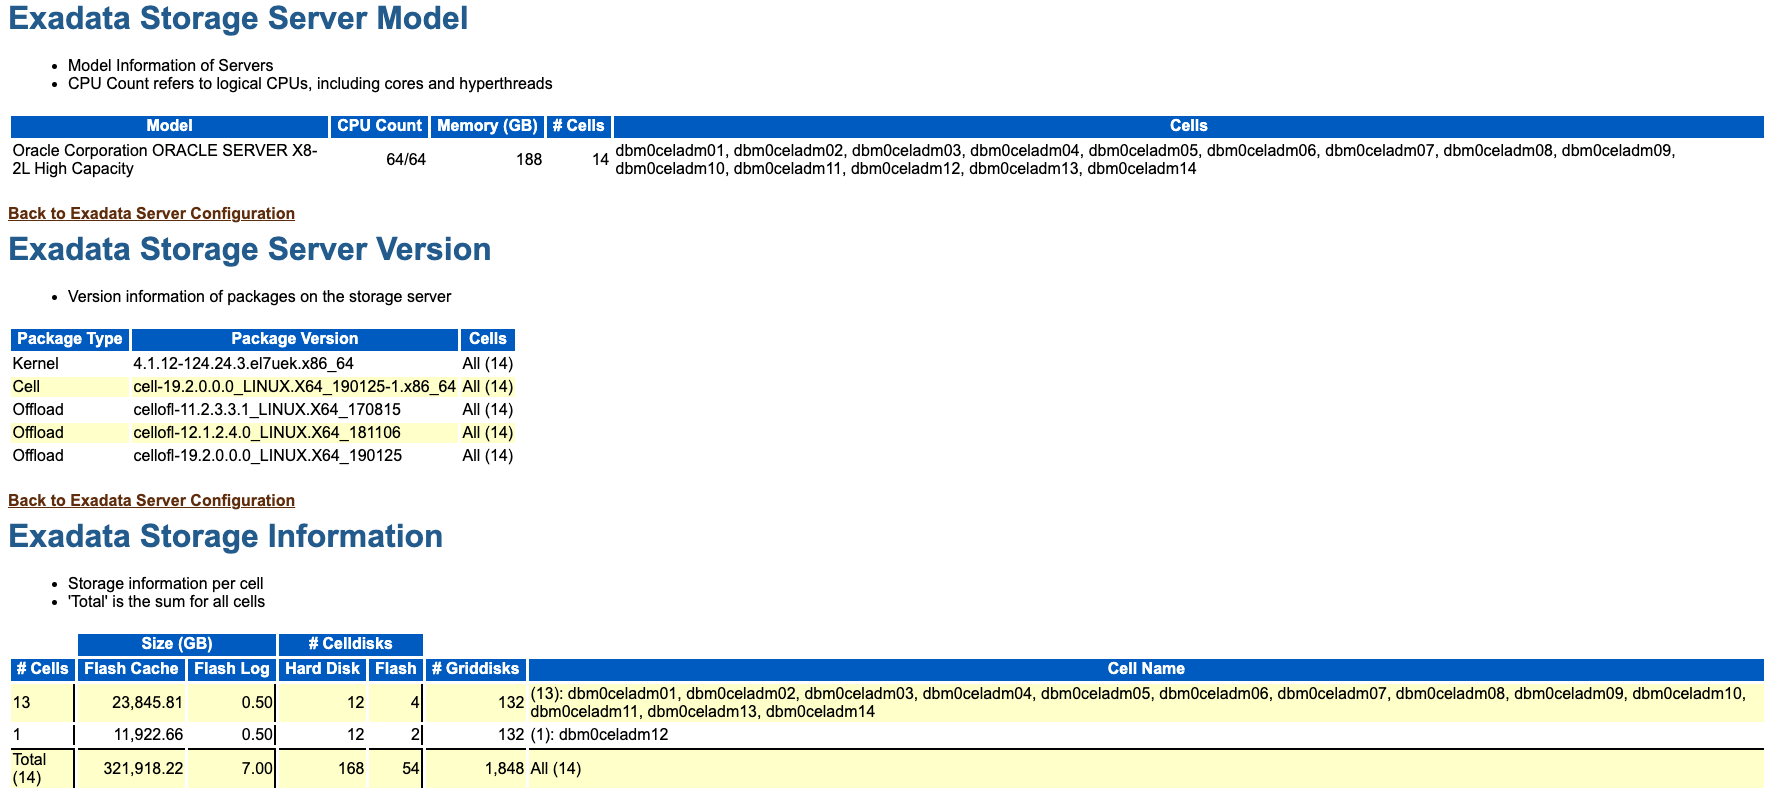
The Exadata Server Configuration section of the AWR report shows configuration information from all of the associated storage servers, including model information, software versions, and storage information relating to cell disks, grid disks, ASM disk groups, and the IORM objective. By examining this information, you can easily see any configuration differences across the storage servers that could potentially affect the behavior or performance of the system.
The following example shows part of the Exadata Server Configuration section. The example is based on a system with 14 X8-2 High Capacity storage servers. In the example, all of the servers have the same software version. However, the storage information shows that one cell contains 2 flash cell disks, while the others all have 4 flash cell disks.
Figure 6-1 AWR Report: Exadata Server Configuration

Description of "Figure 6-1 AWR Report: Exadata Server Configuration"
Exadata Server Health Report
The Exadata Server Health Report section of the AWR report shows information about offline disks and open storage server alerts.
When a disk is offline, then the total I/O bandwidth is reduced, which may affect I/O performance.
Alerts represent events of importance on a storage server that could affect its functionality and performance. Open alerts are alerts that have not been marked as examined by an administrator. For more details, see Exadata Alerts.
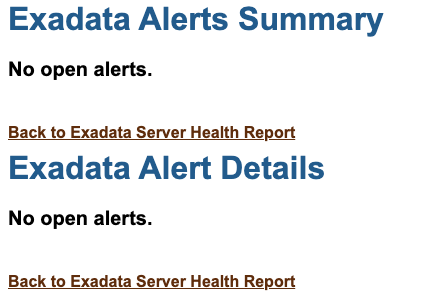
Ideally, there should be no open alerts in the AWR report, as shown in the following example:
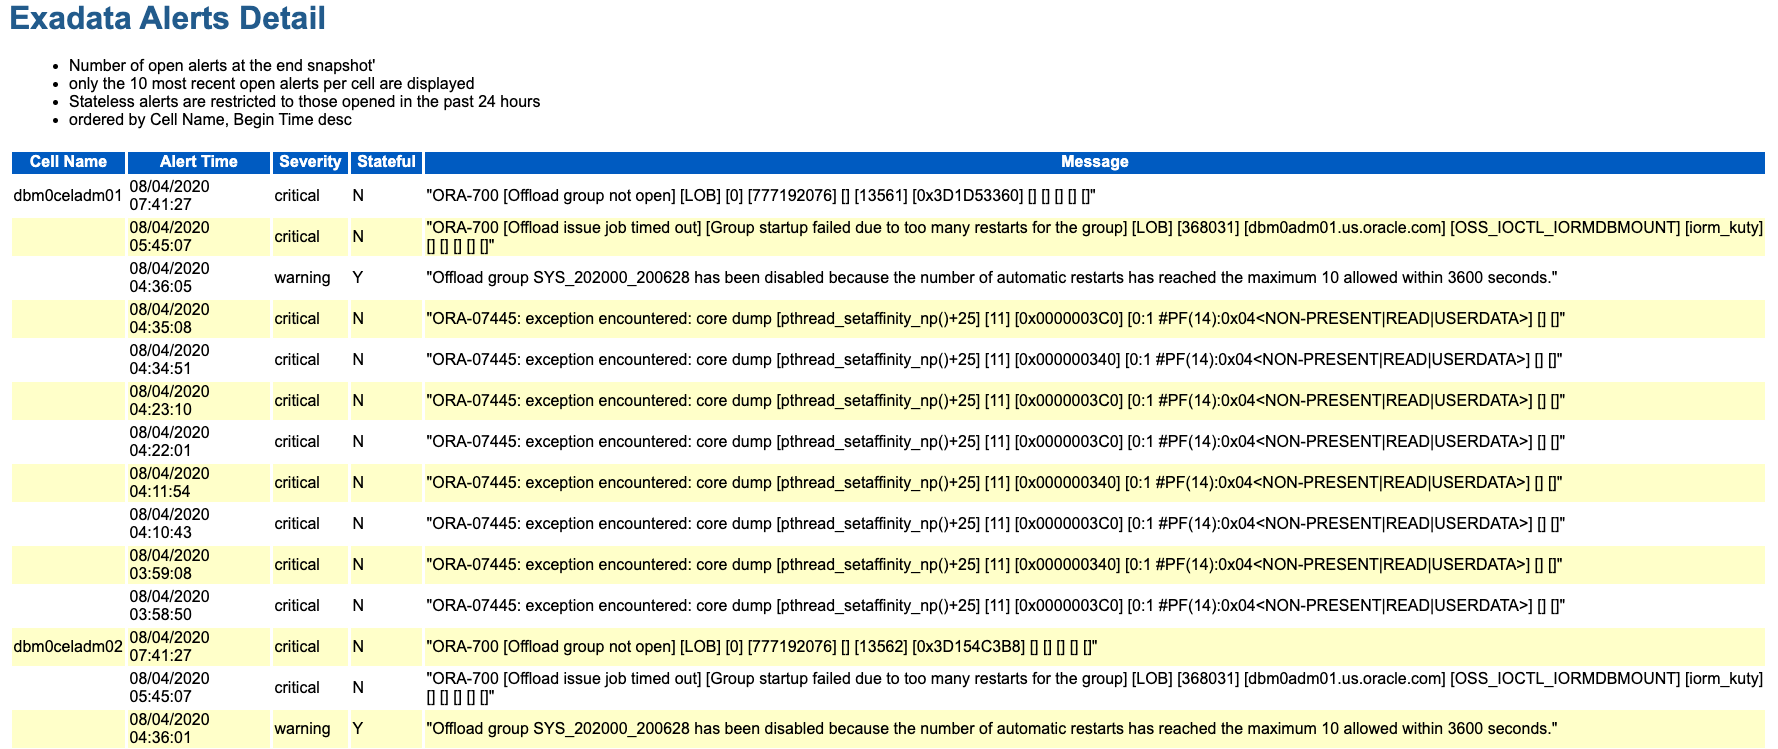
The following example shows Exadata alert details indicating that the offload server was unable to start, which would affect smart scan performance on the system.
Figure 6-3 AWR Report: Exadata Alert Details

Description of "Figure 6-3 AWR Report: Exadata Alert Details"
Exadata Statistics
AWR includes statistics from various Exadata storage server components, such as Smart I/O, Smart Flash Cache, Smart Flash Log, XRMEM cache, XRMEM log, and IO Resource Manager. It includes I/O statistics from both the operating system and the cell server software, and performs simple outlier analysis on these I/O statistics. Because Exadata typically distributes I/O operations evenly across all cells and all disks, outliers may indicate a potential problem and warrant further investigation. If any cell or disk is behaving differently or performing more work, this could potentially cause slower performance for the whole system.
The Exadata Statistics section of the AWR report includes the following sub-sections:
- Performance Summary
- Exadata Resource Statistics
- Exadata Outlier Summary
- Exadata OS Statistics Outliers
- Exadata Cell Server Statistics Outliers
- Exadata Outlier Details
- Exadata OS Statistics Top
- Exadata Cell Server Statistics Top
- Exadata Smart Statistics
- Smart IO
- Flash Log
- XRMEM Log
- Flash Cache
- XRMEM Cache
- Exadata IO Reasons
- Top IO Reasons by Requests
- Top IO Reasons by MB
- Internal IO Reasons
- Exadata Top Database Consumers
- Top Databases by Requests
- Top Databases by Requests - Details
- Top Databases by Throughput
- Top Databases by Requests per Cell
- Top Databases by Requests per Cell - Details
- Top Databases by Throughput per Cell
- Exadata IO Latency Capping
- Cancelled IOs - Client
- Cancelled IOs - Cells
- Exadata Flash Wear
Key Exadata statistics are discussed in detail in the corresponding topics under Monitoring Oracle Exadata System Software Components.
