6.3.9.1 Monitoring Cell Disk I/O Using AWR
The following sections in the Automatic Workload Repository (AWR) report are particularly useful for understanding I/O load on Exadata:
Often, to better understand characteristics about the I/O load, the statistics from these sections can be correlated with other sections in the AWR report.
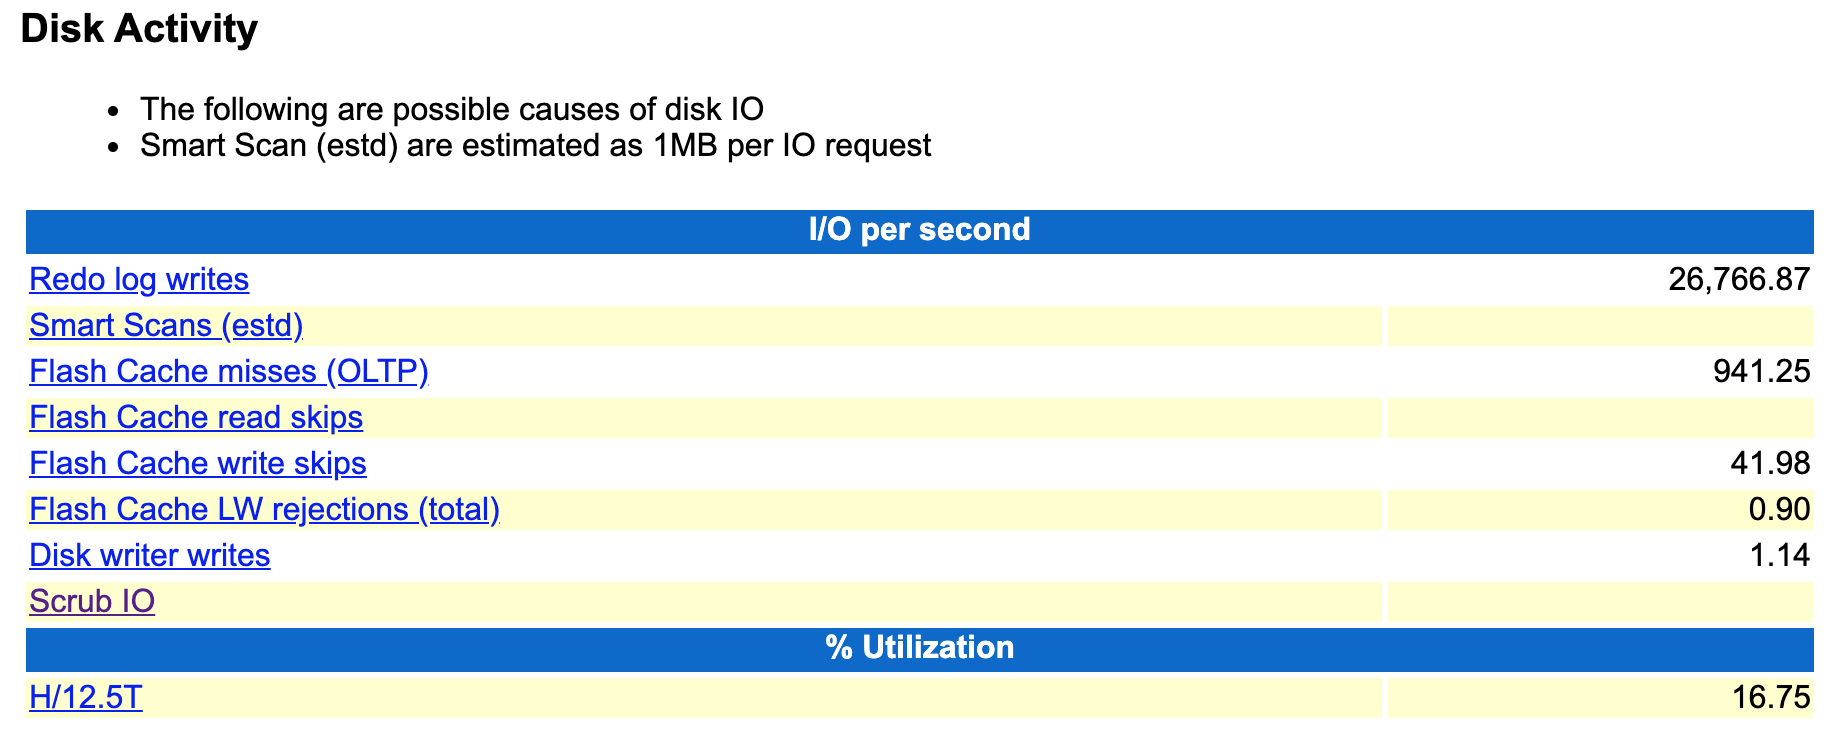
Disk Activity
The Disk Activity section provides a high-level summary for potential sources of disk activity. The Disk Activity section is located in the AWR report under Exadata Statistics > Performance Summary.
Figure 6-26 AWR Report: Disk Activity

High I/O load or a substantial change in the pattern of disk activity may prompt further investigation. Possible causes include:
- Redo log write — result in disk writes when redo is written to disk. When using Exadata Smart Flash Log, note that redo is written to both Exadata Smart Flash Log and the online redo log file. Also, Oracle Exadata System Software release 20.1 adds a further optimization, known as Smart Flash Log Write-Back, that uses Exadata Smart Flash Cache in Write-Back mode instead of disk storage. For further details, review Database Redo Activity and Smart Flash Log in the AWR report.
- Smart Scans — result in disk reads for requests that are not satisfied using Exadata Smart Flash Cache. These are typically large reads. For further details, review Smart IO in the AWR report.
- Flash Cache misses — result in disk reads when requested data does not exist in Exadata Smart Flash Cache. These are typically small reads. For further details, review Flash Cache Misses in the AWR report.
- Flash Cache read skips — result in disk reads when requested data is not eligible for Exadata Smart Flash Cache. For further details, review Flash Cache User Reads - Skips in the AWR report.
- Flash Cache write skips or Flash Cache LW rejections — results in disk writes when data is not eligible for Exadata Smart Flash Cache. For further details, review Flash Cache User Writes - Skips and Flash Cache User Writes - Large Write Rejects in the AWR report.
- Disk writer writes — result in disk writes when data from Exadata Smart Flash Cache in Write-Back mode is persisted to disk. For further details, review Flash Cache Internal Writes in the AWR report.
- Scrub IO — occurs when Oracle Exadata System Software automatically inspects and repairs the hard disks. Scrub I/O is performed periodically when the hard disks are idle, and mostly results in large disk reads, which should be throttled automatically if the disk becomes I/O bound.
The specific causes listed in this section are subject to the version of Oracle Database being used.
Exadata Resource Statistics
The Exadata Resource Statistics section contains many statistics and is organized
into several sub-sections. Primarily, the statistics enumerate the I/O occurring on
the storage servers using information from the storage server operating system (OS)
and Oracle Exadata System Software. From the OS, it
includes statistics relating to I/Os per second (IOPS), throughput, utilization,
service time and wait time. These statistics are equivalent to the statistics shown
by the iostat command. From the Oracle Exadata System Software, it includes statistics relating to IOPS,
throughput, and latency, which are also broken down by small reads, small writes,
large reads, and large writes. These statistics are based on the cell disk
metrics.
The statistics are aggregated by device type, and then by cell or disk. The device type aggregation ensures comparison across the same device type, as different device types are expected to have different performance characteristics. The statistics are presented two ways. Firstly, they are presented to enable outlier analysis. They are also organized to show the 'Top N' cells or disks for a specific statistic.
The outlier analysis presentation allows you to quickly see the statistics aggregated across all storage servers, by cell, and by disk. The display also includes the statistical mean, standard deviation, and normal range. The normal range is based on the mean and standard deviation, not the observed low and high values. For cells, the normal range is the range of values that are plus or minus one standard deviation from the mean. For disks, the normal range is the range of values that are plus or minus three standard deviations from the mean. If there are cells or disks that fall outside the normal range, then they are reported as outliers. This simple outlier analysis is designed to highlight areas for further investigation. However, based on the number of cells or disks in use, and the value of the standard deviation, the outlier analysis may not identify outliers in all cases.
The 'Top N' presentation simply shows the top ranked cells or disks for a specific statistic. This presentation enables you to identify cells or disks that perform more or less work than the others. By using this presentation, you can potentially identify outliers that are not identified by the outlier analysis. Also highlighted in these sections are cells or disks that exceed the expected maximum IOPS for the device or the expected maximum throughput for the device.
The following list outlines the sub-sections in the Exadata Resource Statistics section of the AWR report:
- Exadata Outlier Summary — displays a summary of outliers identified in the various outlier sub-sections.
- Exadata OS Statistics Outliers — contains outlier sub-sections for cells and disks based on OS statistics including, IOPS, throughput (MB/s), utilization percentage, service time, wait time, and CPU utilization per cell.
- Exadata Cell Server Statistics — contains outlier sub-sections for cells and disks based on cell disk metrics, including IOPS, throughput (MB/s), and latency. The statistics are further categorized by I/O type; that is, small read, small write, large read, or large write.
- Exadata Outlier Details — displays detailed information for the identified outliers, along with other statistics related to the outlier.
- Exadata OS Statistics Top — contains 'Top N' sub-sections for cells and disks based on OS statistics, including IOPS, latency, and CPU utilization.
- Exadata Cell Server Statistics Top — contains 'Top N' sub-sections for cells and disks based on cell disk metrics, including IOPS, throughput (MB/s), and latency. The statistics are further categorized by I/O type; that is, small read, small write, large read, or large write.
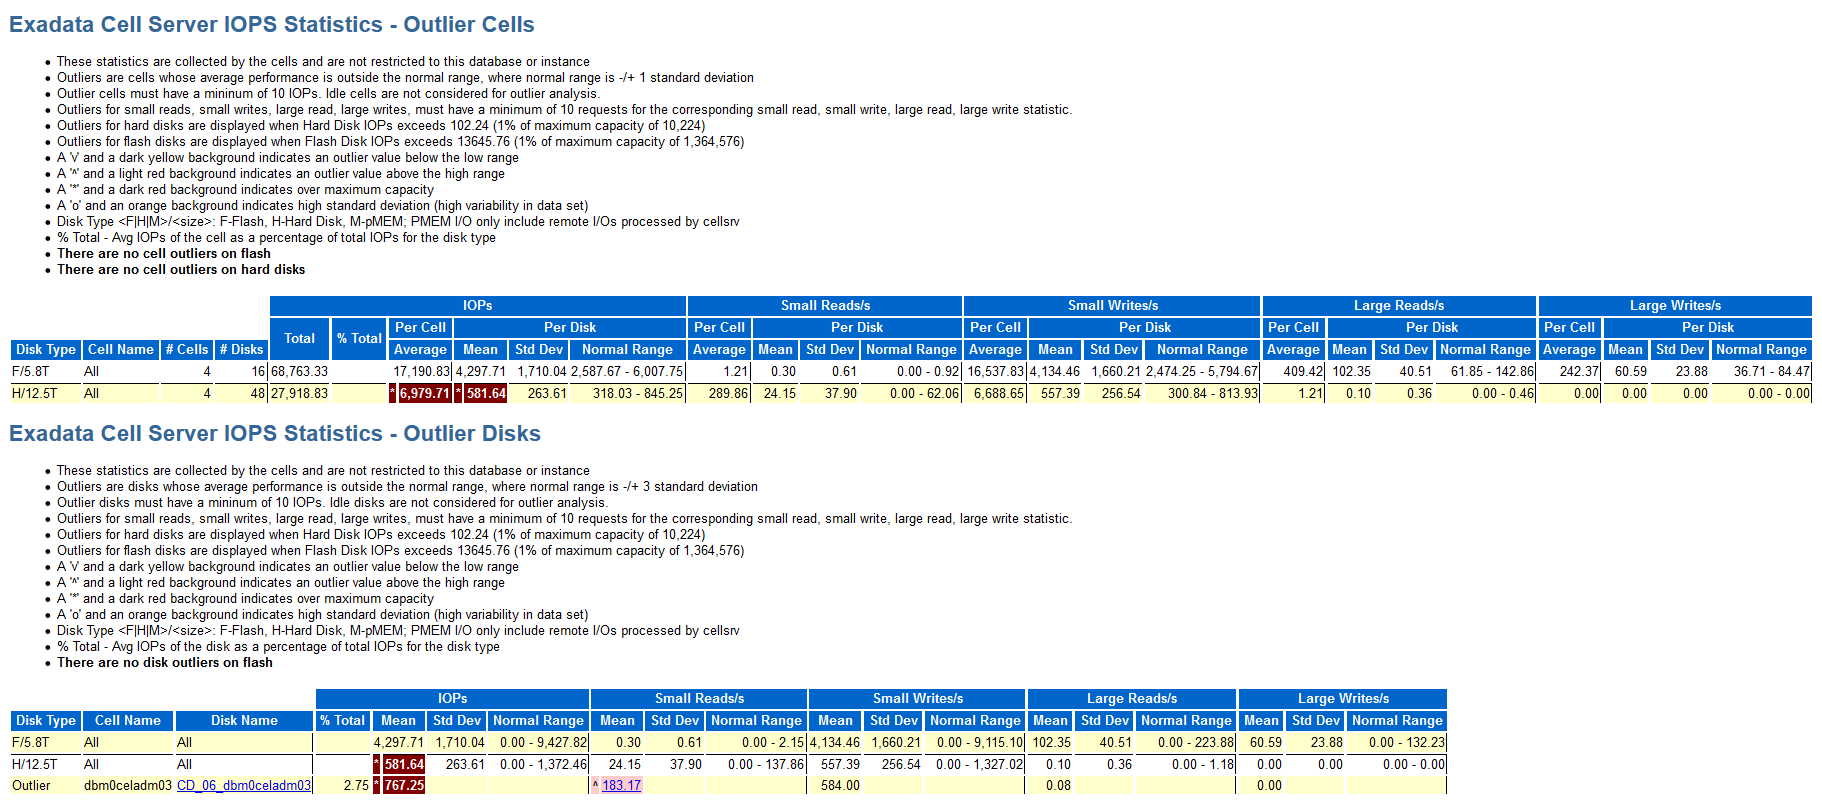
The following example shows two of the Exadata Cell Server Statistics outlier sub-sections in the AWR report. The example highlights that hard disk throughput (IOPS) exceeds the expected maximum, and that a specific disk that is performing substantially more small reads than other disks.
Figure 6-27 AWR Report: Exadata Cell Server IOPS Statistics Outliers

Exadata IO Reasons
When the database sends an I/O request to Exadata, the request is tagged with information that includes the reason for the I/O. This information is aggregated in the Exadata IO Reasons sections of the AWR report and allows you to understand the reasons for performing I/O.
The AWR report contains sub-sections that display the Top IO Reasons by Requests and the Top IO Reasons by MB (throughput). Later versions of the AWR report, further break down the Top IO Reasons by Requests to categorize read requests from flash, write requests to flash, read requests from disk, and write requests to disk.
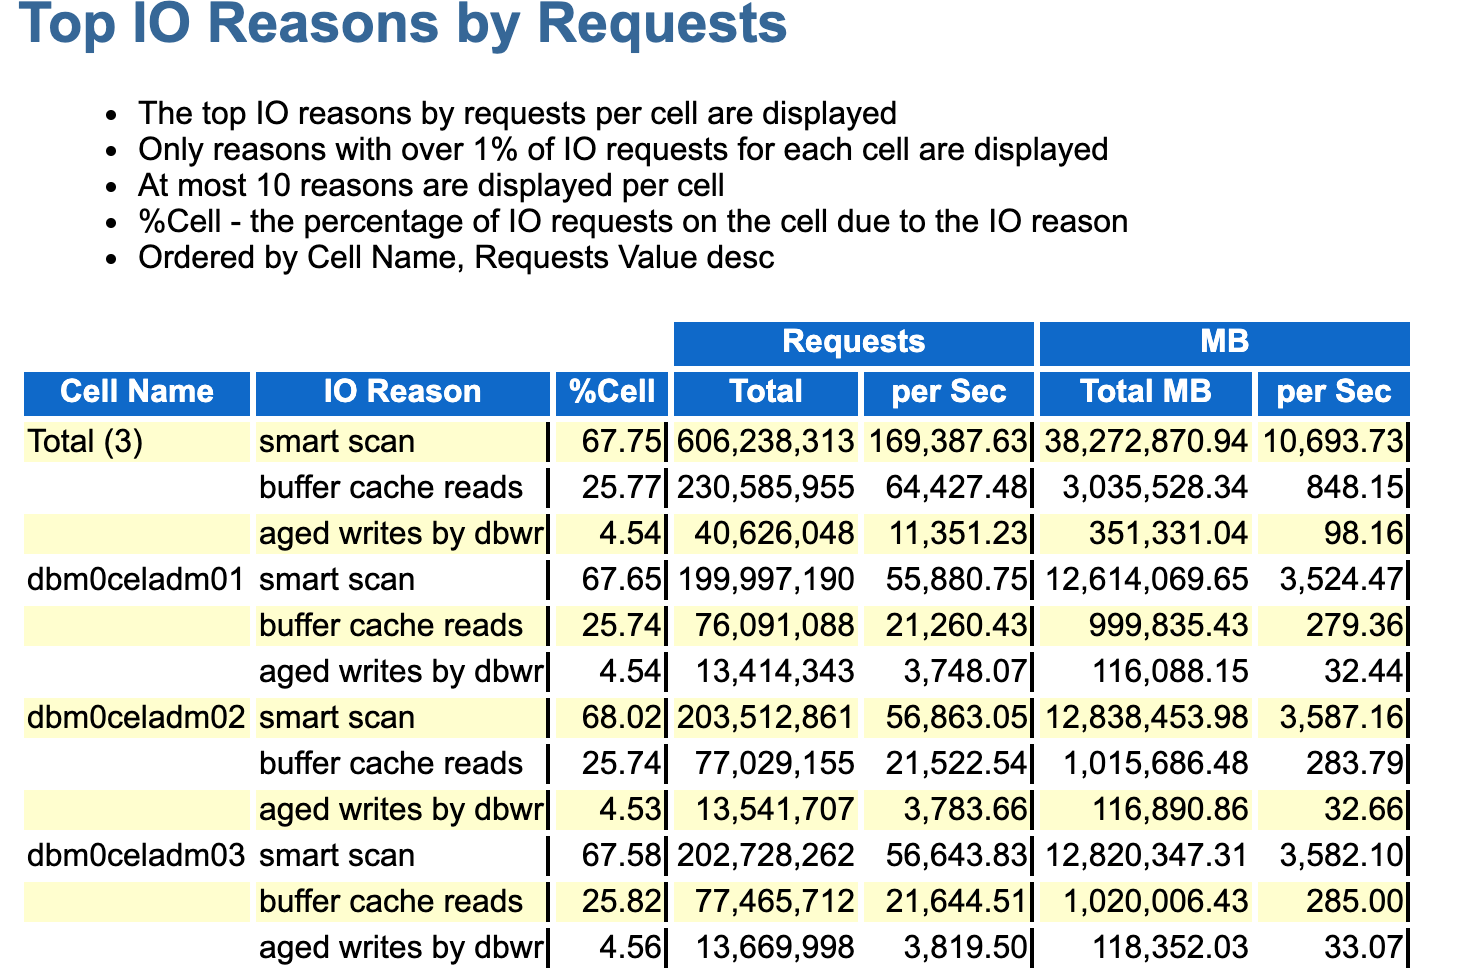
The following example shows Top IO Reasons by Requests. The example output is typical of a well-performing system, with a high proportion of I/O that is associated with Smart Scan, and similar I/O profiles across all of the storage servers.
Figure 6-28 AWR Report: Top IO Reasons by Request

Internal IO Reasons
If Internal IO is among the Top IO Reasons reported, then the AWR report will include a section that summarizes the Internal IO Reasons:
Figure 6-29 AWR Report: Internal IO Reasons

Possible causes of internal I/O include:
- Disk Writer reads — results in flash reads when the disk writer reads from Exadata Smart Flash Cache in Write-Back mode to persist data to disk. For further details, review Flash Cache Internal Reads in the AWR report.
- Disk Writer writes — results in disk writes when the disk writer persists data to disk from Exadata Smart Flash Cache in Write-Back mode. For further details, review Flash Cache Internal Reads in the AWR report.
- Population — results in flash writes when requested data is read into Exadata Smart Flash Cache. When the data is read from disk, it also populates Exadata Smart Flash Cache. This is often correlated with flash cache misses. For further details, review Flash Cache User Reads and Flash Cache Internal Writes in the AWR report.
- Metadata — results in flash writes when new data is written to Exadata Smart Flash Cache in Write-Back mode. This is often due to first writes. For further details, review Flash Cache User Writes in the AWR report.
The specific causes listed in this section are subject to the version of Oracle Database being used.
Parent topic: Monitoring Cell Disk I/O